UK SMEs in 2028: The Cost of Independence in an Optimisation Economy
A conditional forecast of the operating environment through 2028, with interwoven structural scenarios to 2031.

Central question: What will it cost a UK SME to remain economically viable, capable of development and strategically independent by 2028?
How to use this report
Sections 1 to 9 establish the operating environment and the two structural constraints that shape it. Section 10 states eight conditional forecasts for 2028, each with a calibrated confidence level. Section 11 is the quantitative core: seven operating architectures modelled through 100,000 correlated simulations, answering the central question in cash, margin, working capital and debt-service terms. Sections 12 to 14 address the boundary of safe optimisation, the 2031 structural horizon and the conditions under which shared-capability structures work. Sections 15 and 16 make the forecast testable. A reader with limited time should read the Executive Summary, Section 11 and Section 15.
Executive Summary
The UK SME economy is not converging on one future. It is separating into businesses that can absorb a rising minimum level of required capability, businesses that buy scale by accepting deeper dependency, businesses that stay viable through narrow specialisation, and businesses that will need new forms of cooperation to preserve economic independence.
The environment through 2028 is an optimisation economy: external growth too weak to conceal internal inefficiency, while the minimum cost of operating credibly — finance, cybersecurity, data governance, compliance, integration — keeps rising. The OBR's spring 2026 central forecast projects real GDP growth of 1.1% in 2026 and 1.6% in 2027 and 2028, with CPI returning toward 2% [S16]. Returning inflation stabilises the rate of further price increase; it does not reverse the cost level already embedded in wages, energy, finance and software.
The quantified answer to the central question comes from the model in Section 11 — seven calibrated operating architectures, 100,000 correlated simulations, every assumption disclosed:
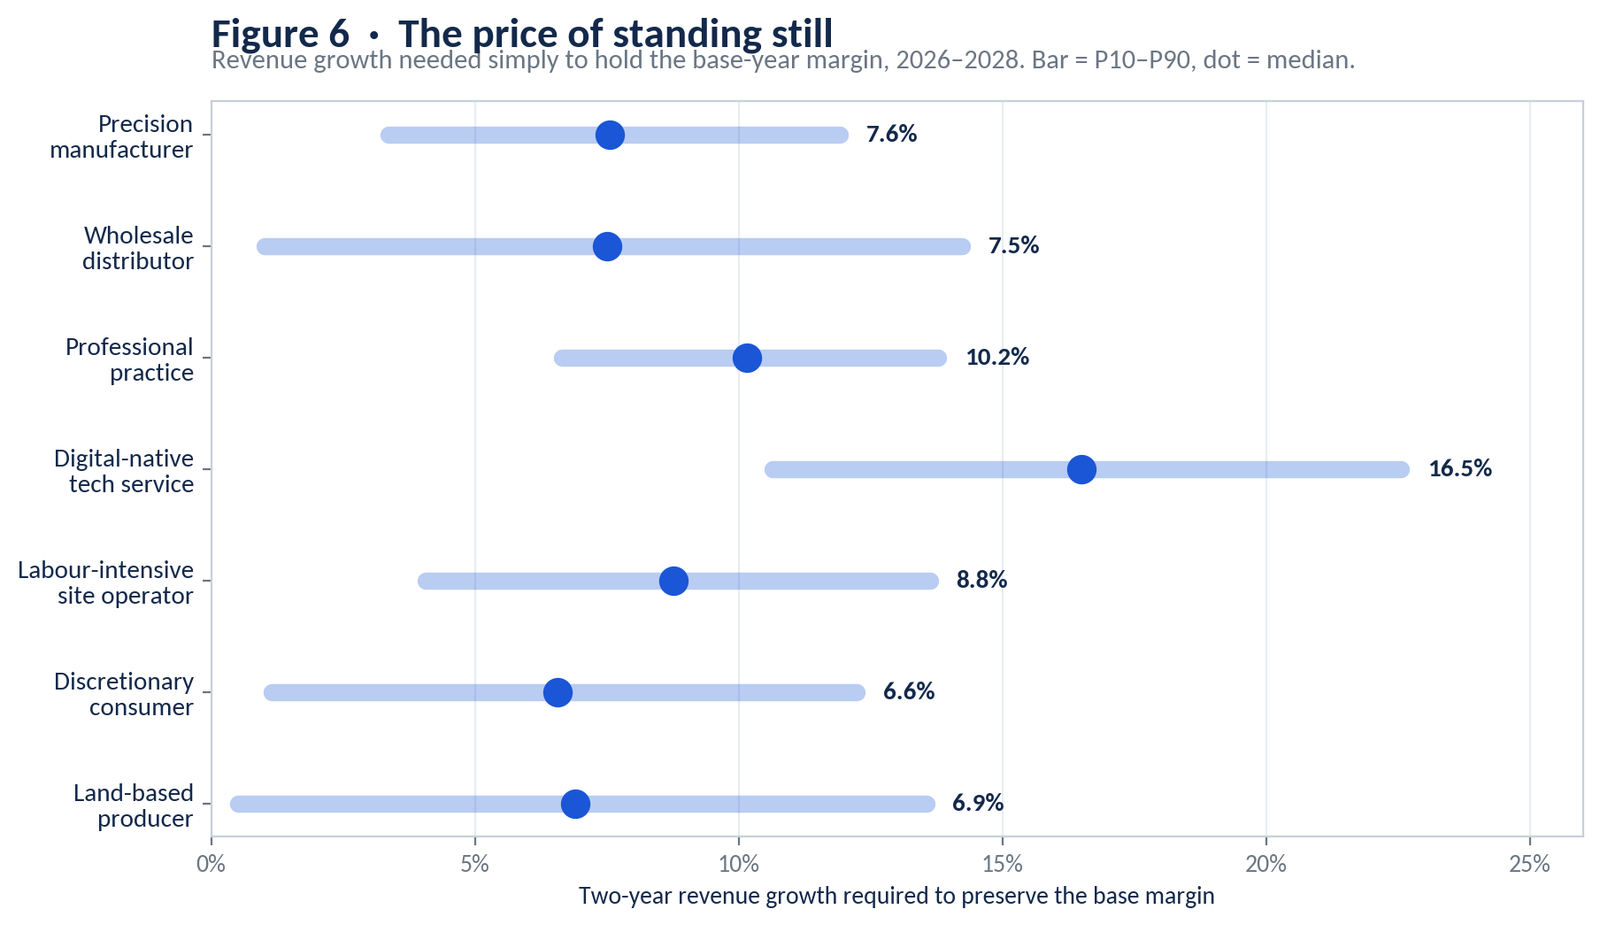
Standing still is not free. Holding the base-year margin requires median revenue growth of 6.6% to 10.2% over two years across the six lower-growth architectures, and 16.5% for the digital service under its assumed 6% annual volume-growth path. This is before any transformation investment.
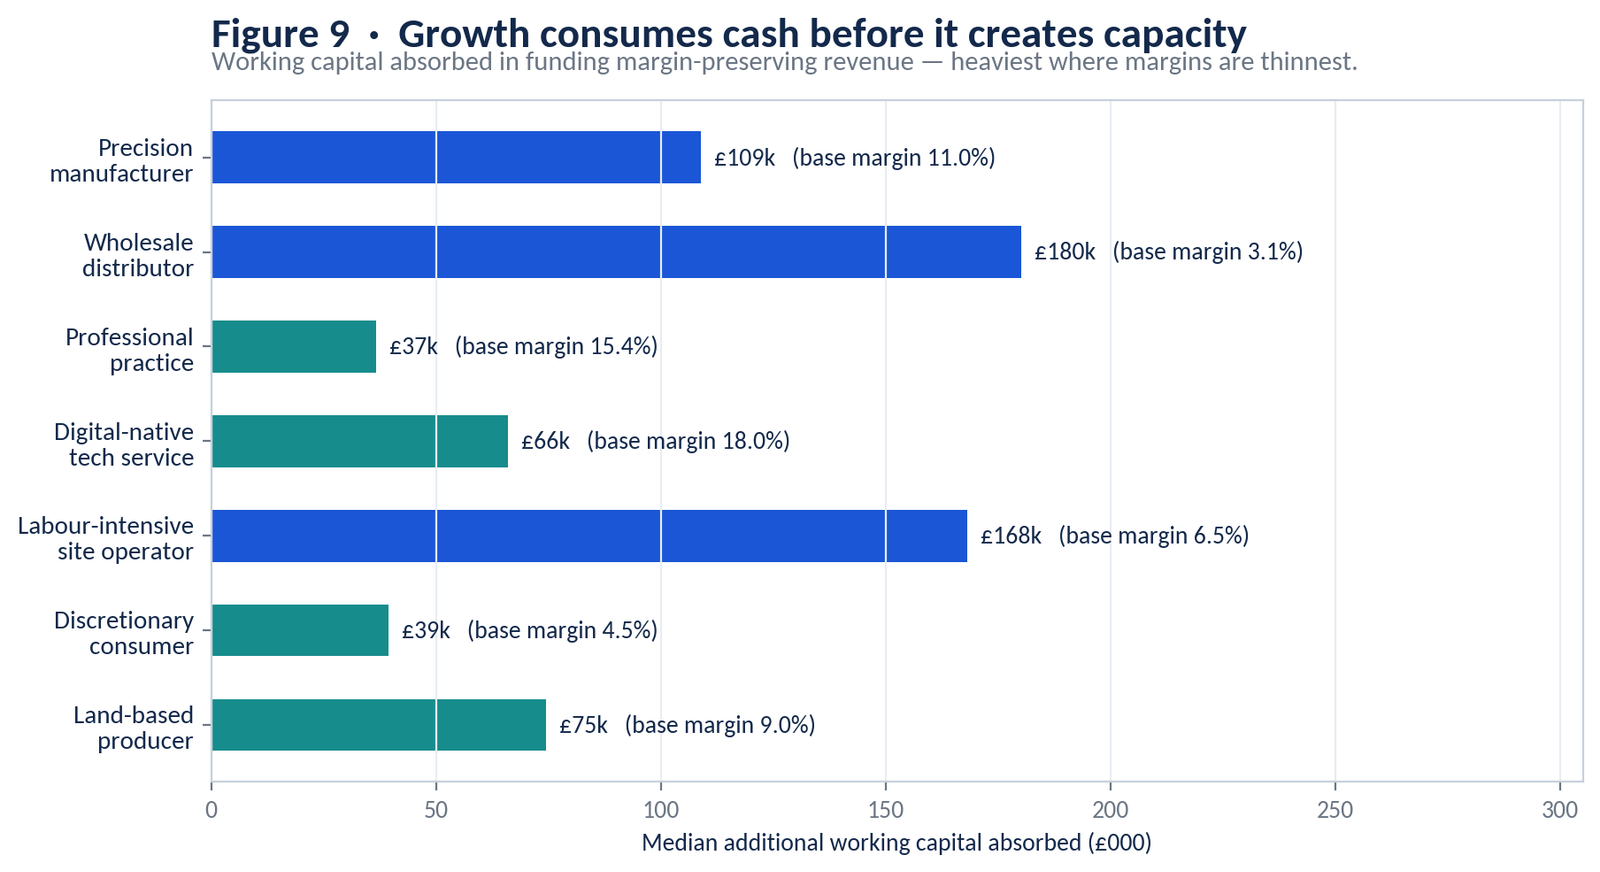
Growth consumes cash before it produces capacity. Financing that margin-preserving revenue absorbs £37,000 to £180,000 of additional working capital depending on architecture — largest precisely where margins are thinnest.
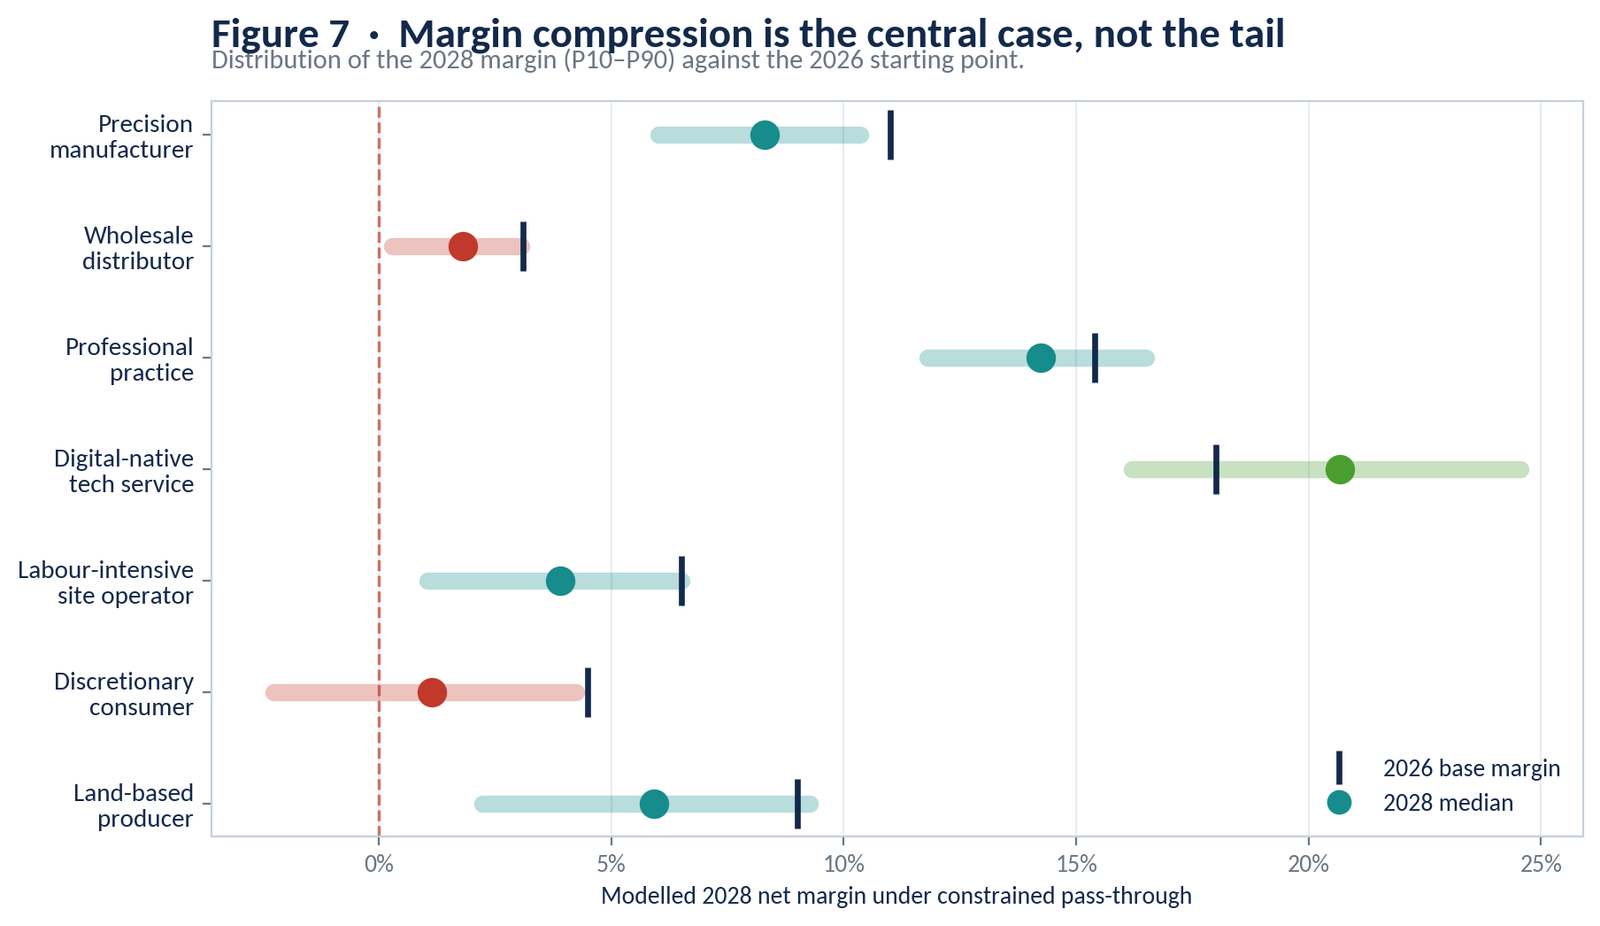
Margin compression is the normal case, not the tail. Median compression runs at 1.2 to 3.4 percentage points, and the probability of losing more than two points of margin exceeds 60% for manufacturing, site operations, consumer-facing businesses and land-based production.
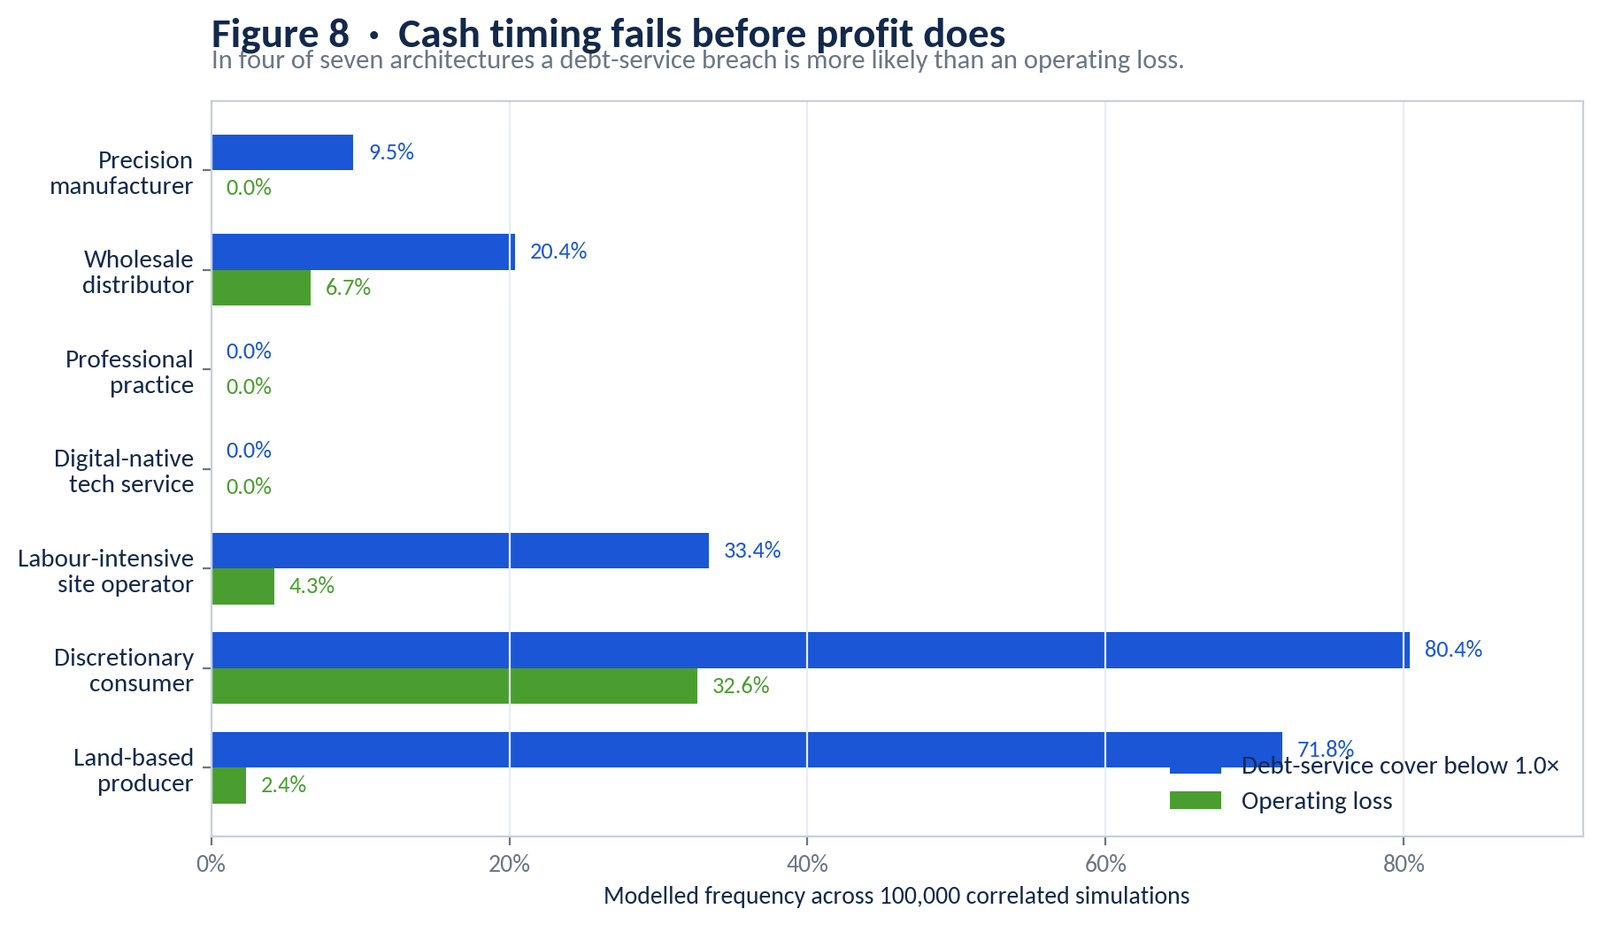
The binding constraint is usually debt service, not profit. A land-based producer shows only a 2.4% probability of an operating loss but a 71.8% probability of debt-service cover falling below 1.0×. Collateral value and cash generation are different things, and lenders test the second.
Exposure follows architecture, not size. The £20m distributor is more fragile than the £3m professional practice. The weakest case is the discretionary consumer business: a 32.6% probability of an operating loss and an 80.4% probability of debt-service breach.
Three structural findings frame those numbers. First, the cost of viability exceeds the increase in operating expenses, because the firm must simultaneously finance growth, defend margin, fund additional working capital and renew productive capacity. Second, the binding constraints are architectural rather than sectoral: capital intensity, working-capital velocity, pass-through power and dependency concentration matter more than headcount. Third, effective independence is becoming more expensive than formal independence — a firm can remain legally owned by its founders while losing control of customer access, data, finance and technical standards.
For 2031, four structural states — platform-dependent tenancy, symbiotic scalability, fragmented attrition and modular niche autonomy — are mapped on two explicit axes: concentration of operating control, and pace of physical technology deployment. They are expected to coexist across sectors and regions rather than resolve into a single national outcome, and no probabilities are assigned to them.
Section 15 sets out twelve dated signposts with named resolution sources, so that the forecast can be scored rather than merely read.
Introduction
The UK business environment has been under structural pressure for well over a decade, and the evidence does not need embellishment.
Since 2012 the consumer price level has risen by roughly half: what £1 bought then requires about £1.50 today, equivalent to losing around a third of the pound's domestic purchasing power [S36]. The pandemic reduced annual real GDP by approximately 10% in 2020 [S37]. The Office for Budget Responsibility's long-run counterfactual assumption — an assumption rather than an observed subtraction — is that leaving the EU reduces long-run productivity by around 4% relative to remaining [S39]. Real GDP measured in chained volumes has nonetheless grown by roughly a fifth since 2012 [S37], while real household disposable income per head is only some 4–5% higher [S38]. Growth has occurred, but only a small part is reflected in the increase in real household disposable income per head.
The political backdrop has been unstable — seven Prime Ministers and ten distinct administrations since 2012, most recently the change of premiership in July 2026 — alongside supply-chain disruption, an energy-price shock, higher interest rates, geopolitical fragmentation and erosion of the post-1990 trading order [S42] [S43]. Successive monetary interventions supported asset prices and compressed yields [S40] [S41]; how far they redirected capital toward technology rather than physical infrastructure is a matter of statistical inference, and is treated as such throughout.
Beneath the headline series sit deeper problems: weak labour productivity growth [S17], the lowest total investment share in the G7 [S18], elevated industrial energy costs [S07] [S47], selective access to capital [S10] [S24], declining business dynamism and more persistent market leaders [S19], and growing dependence on a small number of financial, technological and distribution infrastructures [S20] [S21] [S22].
Current developments do not point to imminent technological abundance. Software-level maturity in artificial intelligence cannot deliver near-term transformation without the electricity, semiconductors, equipment, finance and organisational capacity required to deploy it [S04] [S05] [S28]. They point instead to an optimisation economy: an environment in which businesses must extract more sustainable value from every unit of labour, capital, working capital, energy, physical capacity and management attention.
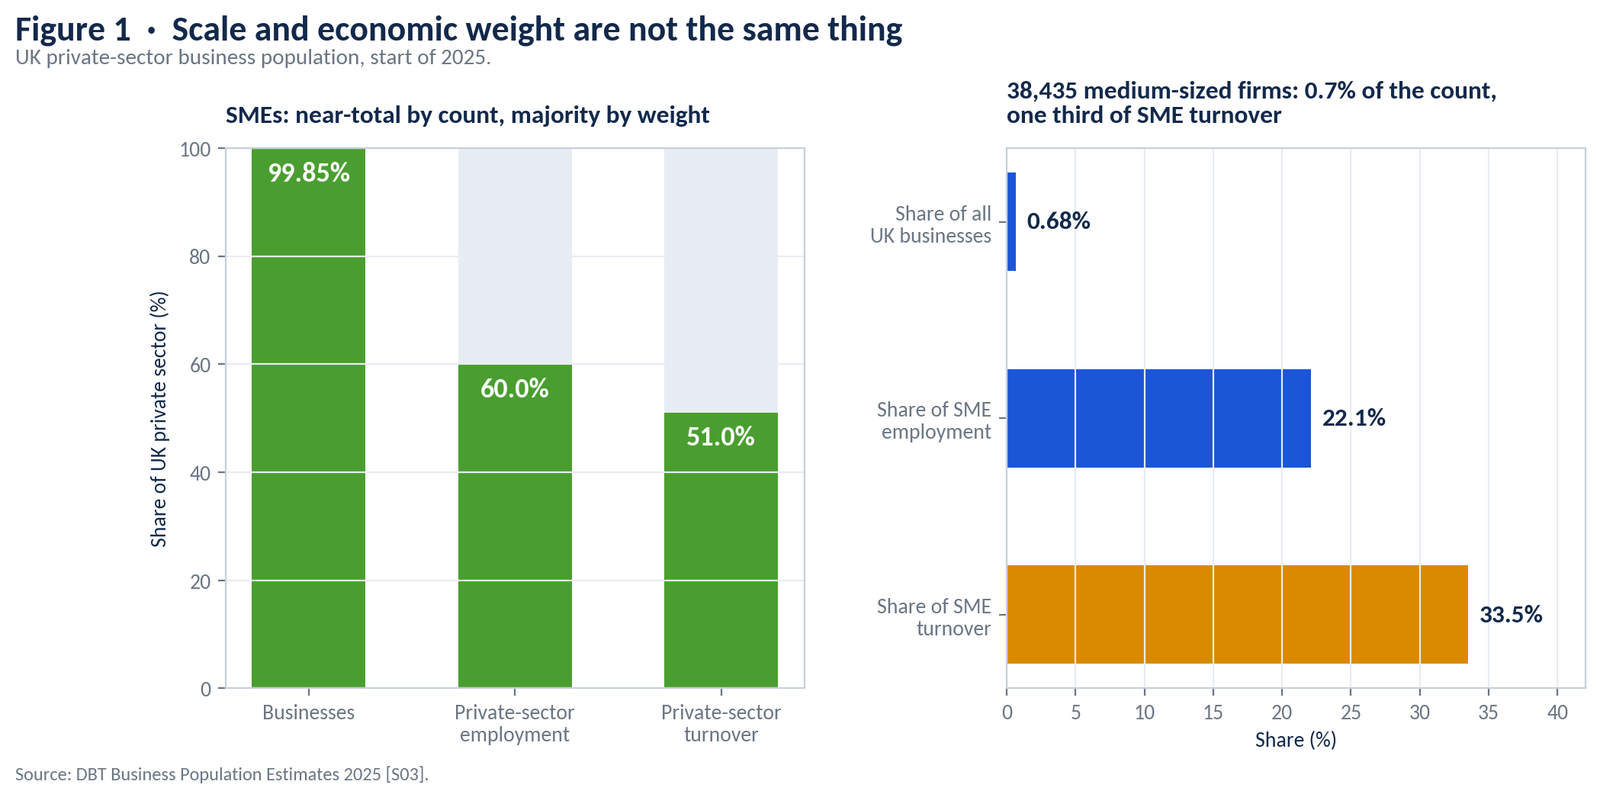
The baseline population is taken from the start of 2025, the latest complete official estimate at the evidence cut-off: approximately 5.69 million private-sector businesses, of which SMEs were 99.85%, employing 16.9 million people — around 60% of private-sector employment — and generating roughly £2.83 trillion, or 51% of measured private-sector turnover [S03].
Two horizons are used. 2028 is the forecast horizon, where existing projections, labour-market data, financing conditions and adoption trends support a bounded, conditional operating forecast. 2031 is the structural scenario horizon, where frontier AI, robotics, market concentration, regulation, energy and geopolitics may introduce regime changes that no single deterministic forecast can capture reliably.
1. How This Forecast Should Be Read
This is not a prediction that every SME will experience the same outcome. The category contains millions of businesses with incompatible economic structures. The purpose is to identify the forces already sufficiently established to shape the environment through 2028, quantify their combined effect on representative operating architectures, and then examine the organisational states that may emerge as those forces interact through 2031.
Six types of statement are used, and every material claim in the supporting evidence ledger is assigned to one of them: observed facts, taken from official or institutional measurement; calculated indicators, being transparent arithmetic on observed data; statistical inferences, meaning patterns consistent with the evidence without a claim of isolated causality; conditional 2028 forecasts; 2031 structural scenarios; and unresolved hypotheses.
1.1 Confidence calibration
Each confidence label corresponds to a stated probability that the forecast statement will hold, conditional on the assumption set in Section 10: no new pandemic-scale shock, no direct major-power conflict involving the UK, and no disorderly sovereign or banking crisis. The labels exist to be scored against the signposts in Section 15.
| Label | Conditional probability | Interpretation |
| High | at least 80% | Multiple independent drivers point in the same direction, with no comparably strong countervailing mechanism in the current evidence. |
| Medium-high | 65% to 80% | The balance of evidence clearly favours the statement, with one identifiable path to being wrong. |
| Medium | 50% to 65% | More likely than not, with material structural uncertainty remaining. |
The forecast does not assume that artificial intelligence caused every labour-market, productivity or investment change occurring alongside its adoption, and it does not treat corporate visions of abundance as proof of future output. Statements by technology leaders and governments are used as scenario evidence: they reveal investment direction and expectations, not guaranteed outcomes [S32] [S33] [S34]. The mathematical expressions are decision models unless a result is explicitly identified as an observed statistic, a calculated indicator or a disclosed simulation output.
2. The SME Definition and the Fragmentation Beneath It
2.1 One term, several populations
Under the UK Procurement Act framework an SME generally employs fewer than 250 people and has annual turnover not exceeding £44 million or a balance-sheet total not exceeding £38 million, with ownership and structural links also considered; the guidance is explicit that the definition is specific to the procurement regime. Companies Act thresholds use a different combination of tests [S01] [S02]. “SME” is an administrative category built for regulatory and statistical purposes. It is not a description of economic architecture.
Within the 2025 population, only 38,435 businesses were medium-sized by employment band, yet they employed 3.74 million people and generated almost £949 billion of turnover — roughly a third of SME turnover and more than a fifth of SME employment from under 0.7% of the business population [S03]. Micro-enterprises form the numerical perimeter of the economy; medium-sized enterprises form a disproportionately important connective layer between local supply, specialist capability, regional labour markets, large buyers and institutional finance.
2.2 Headcount disguises economics
A 100-person software provider, a precision engineering manufacturer, a wholesale distributor, a private healthcare facility and a civil engineering contractor can all sit in the same size band while sharing almost none of the same economics: development-heavy cost curves and cloud dependence; machinery with long replacement cycles and energy sensitivity; high turnover on narrow gross margin financing a large working-capital cycle; stable demand with limited labour substitutability; profit on paper with exposure to retentions and payment delay.
This is why turnover per employee fails as a universal productivity measure. On the 2025 totals, medium-sized businesses reported more turnover per employee than the aggregate large-business category — which proves nothing, because turnover includes commodity pass-through, inventory flows and subcontracted activity [S03]. Productivity is better approached through gross value added, value added per employee, capital productivity and cash conversion.
2.3 Seven operating architectures
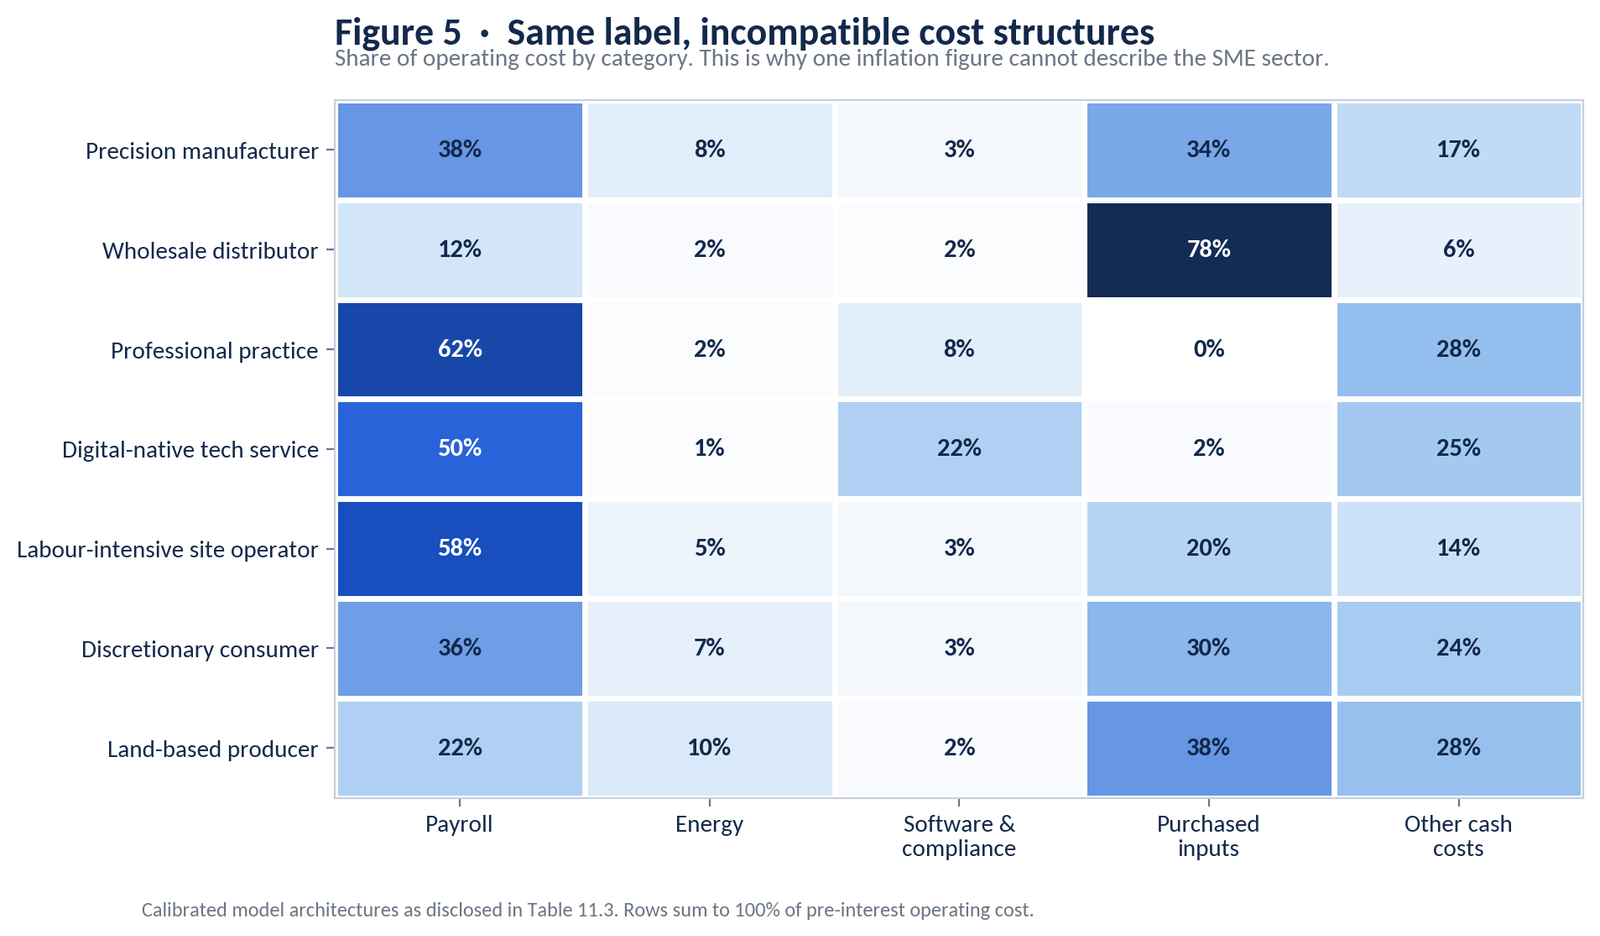
For forecasting purposes the SME population is organised into seven economic architectures — models of how resources behave, not industry codes: capital-intensive physical production; high-velocity working-capital businesses; asset-light knowledge and professional services; digital-native software and technology services; labour-intensive site operations; discretionary consumer and local services; and land-based biological production. Each is defined by capital intensity and irreversibility, technology absorption velocity, ecosystem position and shock resistance. All seven are quantified in Section 11.
The consequence is that the cost of remaining viable to 2028 cannot be expressed as a single percentage. It must be calculated through the architecture of the firm.
3. The Four-Resource Economy
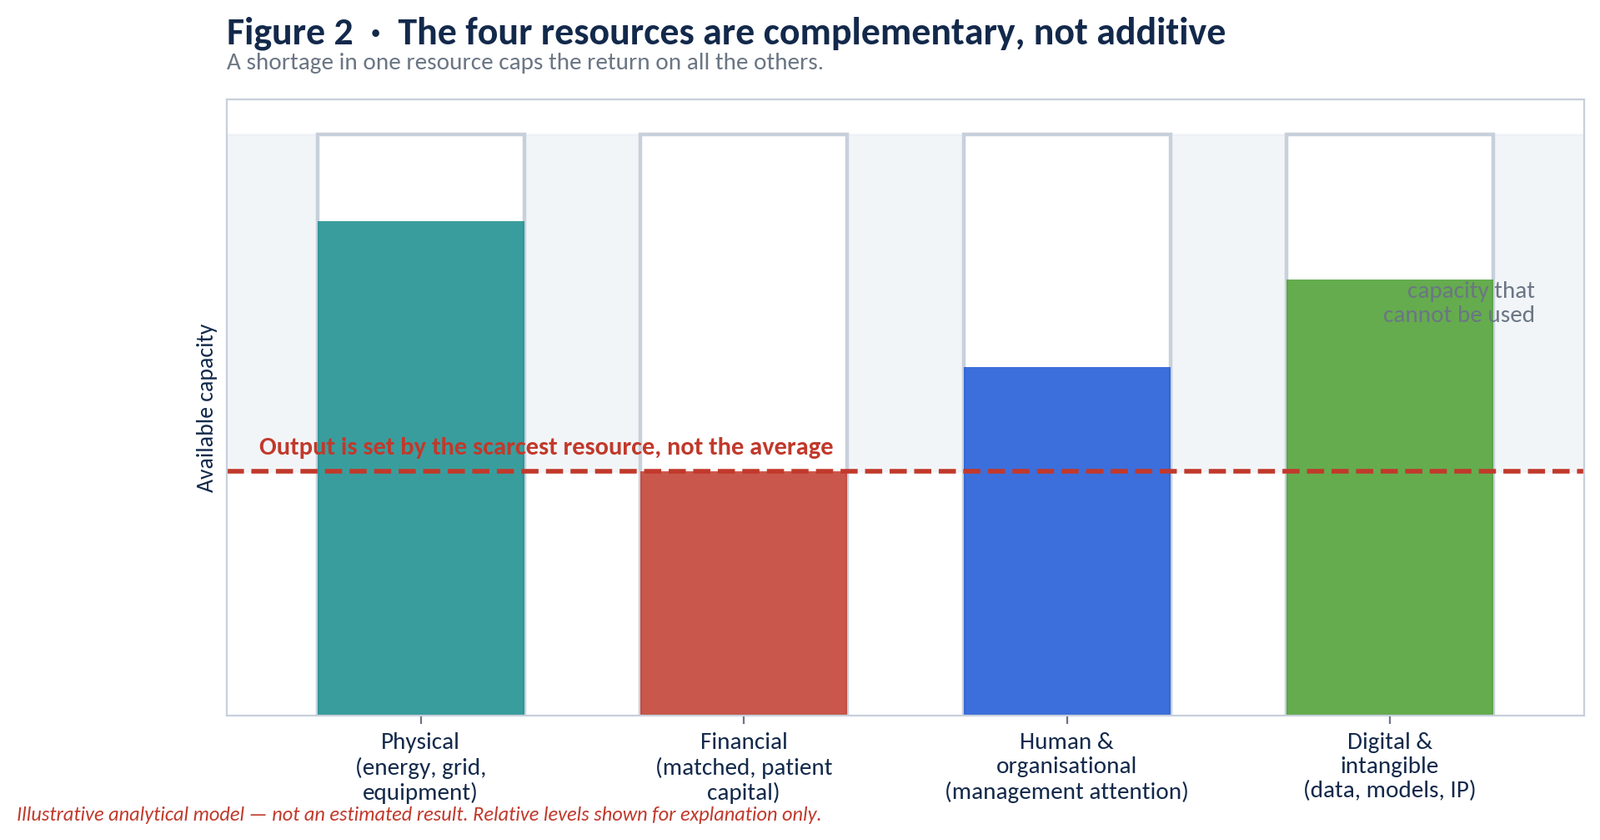
Optimism about digital technology often treats information as if it sat outside the physical economy. It does not. Any credible forecast must account for four resource groups — physical, financial, human-organisational, and digital-intangible — in a production function that is complementary rather than additive: a shortage in one reduces the return on all the others.
3.1 Physical resources
The physical constraint is now visible inside the digital economy itself. The International Energy Agency estimates data centres consumed about 415 TWh of electricity globally in 2024 and could reach roughly 945 TWh by 2030, with growth geographically concentrated [S04]. The UK connection queue illustrates the problem: government reporting recorded a 460% expansion of the demand queue in the six months to June 2025, with some projects facing waits of up to 15 years [S05] [S06]. Software capability may be deployable in days; the power, transformer, site and network reinforcement needed to run it at industrial scale can take years.
Industrial energy remains a direct competitiveness issue. ONS analysis found business electricity prices rose by more than 90% from early 2021 to their peak and remained substantially above the starting level in late 2024, while output in energy-intensive industries fell by roughly a third [S07]. DESNZ data show non-domestic prices easing after the crisis peak but remaining structurally elevated, and high relative to international peers [S08] [S47] [S48].
3.2 Financial resources
The distinction that matters is between funding and financeability. A firm may hold an overdraft or invoice facility and still be unable to finance a multi-year transformation, because the instrument must match the economic life of the capability being acquired. By April 2026 the effective rate on new SME bank loans was approximately 6.16% [S09]. The Bank of England's Q2 2026 Credit Conditions Survey reported slightly reduced credit availability and lower approval rates for smaller firms, with comparatively better conditions for large companies [S10]. The British Business Bank nonetheless found around half of smaller businesses using external finance, with gross SME lending recovering [S11]. Finance has not disappeared; suitability, maturity, cost and independence are the constraints.
3.3 Human and organisational resources
Technology implementation is usually budgeted as software plus training. In practice the scarce resource is management attention: someone must define the process, clean the data, redesign controls, manage suppliers and hold a recovery path open while the new system stabilises. In July 2026, ONS data showed falling payroll employment, declining vacancies, unemployment at 4.9%, and reduced inactivity among people aged 50 to 64, with vacancies below their pre-pandemic level yet shortages persisting in regulated, technical and physical roles [S12] [S13] [S14]. These indicators are consistent with cautious hiring and selective restructuring; they are not proof that AI caused aggregate employment change.
3.4 Digital and intangible resources
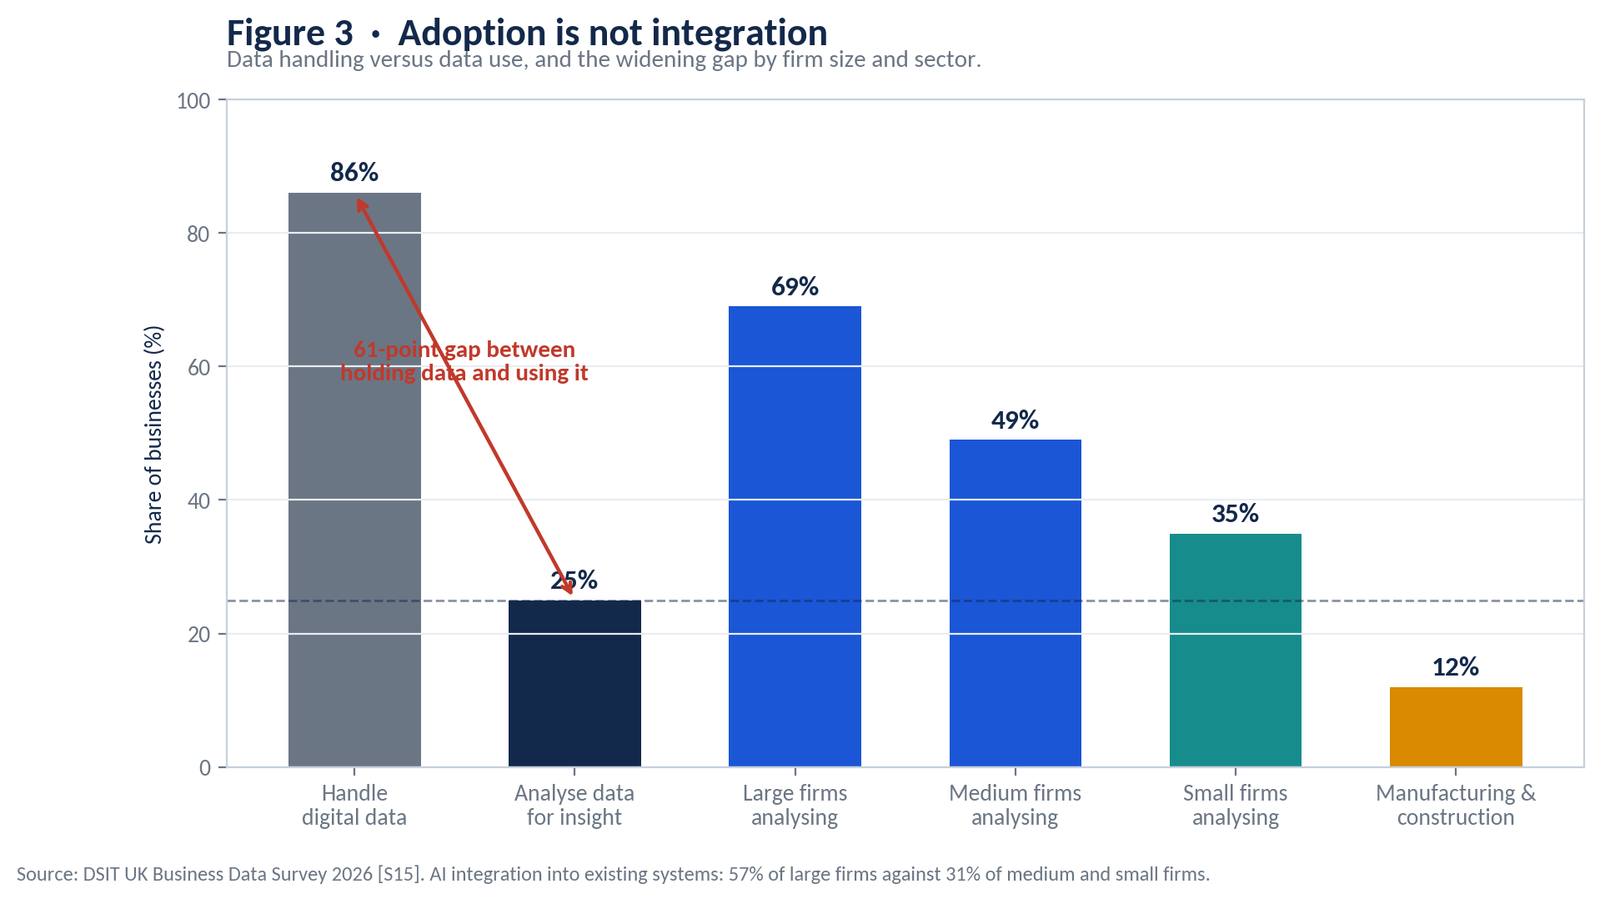
The UK Business Data Survey 2026 found 86% of businesses handled digital data, yet only 25% analysed data to generate insight — 69% among large firms, 49% among medium-sized businesses, 35% among small businesses, and only 12% in manufacturing and construction. Among businesses already using AI, 57% of large firms had integrated it into existing systems against 31% of medium and small firms [S15]. Adoption is spreading faster than integration, and the same survey exposed a governance gap: only a minority of AI users had formal policies, while many businesses were uncomfortable with their data training external models. The value of AI depends on access to operating data, so the strategic cost of adoption can include disclosure, lock-in and loss of control over the firm's informational assets.
The four resources interact. A business can hold excellent software but insufficient working capital; modern machinery but no skilled operators; cash but no grid connection; data but no lawful or reliable way to use it. No credible abundance forecast can be built from model performance alone.
4. The Optimisation Economy
An optimisation economy is not simply one using more automation. It is an environment in which external growth is insufficient to conceal internal inefficiency while the minimum cost of operating credibly continues to rise.
The macroeconomic baseline fits that description. The OBR's spring 2026 central forecast projects real GDP growth of 1.1% in 2026 and 1.6% in 2027 and 2028, with CPI returning toward 2% [S16]. Productivity remains weak, with limited improvement in output per hour since the pandemic and market-sector multifactor productivity below its 2019 level [S17] [S54], and the UK's total investment share remains the lowest in the G7 [S18]. The operating mandate that follows is uncomfortable but simple:
Required internal efficiency growth > available external market growth
This is not an argument for indiscriminate cost reduction. It means more GVA per employee rather than merely more turnover per employee; more contribution per unit of working capital; higher utilisation without removing maintenance capacity; better conversion of management attention into repeatable process; fewer failure losses; and greater durability per unit of investment. The optimisation economy rewards firms that combine resources into reliable systems and punishes firms that optimise one line while creating hidden fragility elsewhere — the boundary formalised in Section 12.
5. Concentration Without Consolidation
5.1 Why the company register no longer shows the structure
A business can remain a legally independent company while depending on the same platform for customer acquisition, the same cloud provider for operating systems, the same card networks for settlement, the same lender for liquidity and the same anchor customer for most of its revenue. Nothing in the Companies House record changes. The firm's operating choices narrow.
The CMA's economy-wide analysis shows both the value and the limits of conventional measurement: average UK industry concentration was broadly similar to its 1997 level, yet mark-ups had risen, business dynamism had declined, young firms accounted for less turnover and employment, and established leaders were more persistent — while the CMA itself noted that concentration measures omit vertical relationships, international control and other dimensions of market power [S19]. Modern concentration therefore needs a wider definition: control of infrastructure, interfaces, standards, data, transactions and exit routes.
5.2 Formal and effective independence
Formal independence = legal ownership + formal decision rights
Effective independence = continuity capacity + viable alternatives + exit capability + recovery capacity
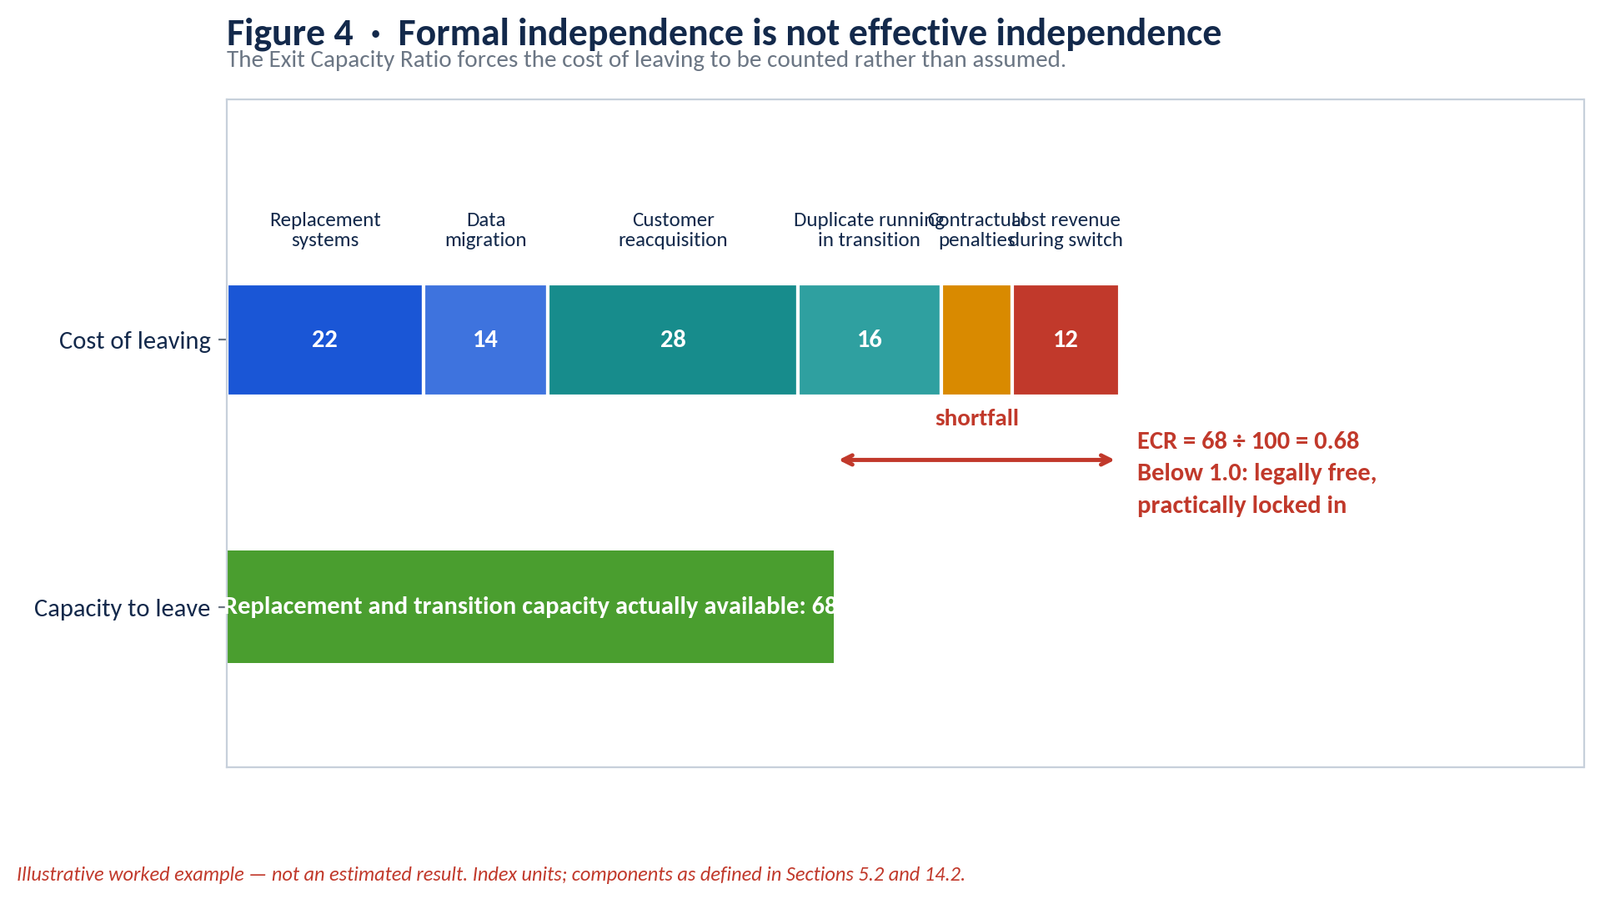
A firm may in theory be free to leave a platform. If leaving requires rebuilding customer access, migrating years of data, replacing integrated software, funding a period of disrupted revenue and carrying duplicate systems through transition, that freedom may not be economically executable. The cost of independence is therefore:
Cost of independence = replacement cost + transition cost + lost shared benefits + risk buffer
5.3 Two gatekeeping systems
SMEs increasingly operate between two interconnected gatekeeping systems. The financial-capital system controls access to money, credit, collateral and risk allocation: which cash flows are bankable, what maturity is available, how much risk stays with the entrepreneur. The digital-platform system increasingly controls operating infrastructure: cloud capacity, AI models, software, data, payments, customer discovery and technical standards.
Neither should be treated as a conspiracy. Their power lies in concentrated allocation and rule-setting capacity, and they are interconnected: cloud platforms offer credit and payments, financial institutions depend on a small set of technology providers, and software vendors increasingly control the data formats used to establish financial credibility. UNCTAD estimated three providers controlled more than two-thirds of the global cloud market, with an exceptionally concentrated high-performance GPU market [S20] [S52]. The CMA's cloud investigation identified barriers around switching, egress charges, interoperability and licensing, and recommended strategic-market investigation of the two largest providers [S21]. The OECD finds platforms lower SME entry costs and extend reach while imposing fees, requiring access to commercially sensitive data, and creating switching costs that rise as the relationship deepens [S22].
5.4 Three relationship states: mutualistic, asymmetric, extractive
Not every ecosystem is harmful. Shared systems create real productivity and lower fixed costs; the analytical question is how value and autonomy are distributed. In a mutualistic relationship every essential participant receives durable net value. In an asymmetric relationship one participant gains substantially while the other is neither helped nor immediately harmed — the risk here is temporal, because a relationship can look harmless today while eroding future bargaining power and exit capacity. In an extractive relationship one party increases its surplus by reducing the viability or autonomy of the other, keeping the dependent firm alive at the minimum level needed to keep supplying transactions, labour, data or customers. Modern concentration can therefore be stated precisely: distributed legal ownership combined with concentrated resource control — the structure conventional business counts cannot detect.
6. The First Constraint: The Rising Minimum Capability Floor
The Minimum Capability Floor is the set of capabilities a business must maintain to operate credibly, securely and legally: finance, management accounting, planning, cybersecurity, data governance, compliance, systems integration, evidence retention, insurance, resilience and recovery.
Most of these costs are fixed or semi-fixed. A compliant payroll process or data-protection framework does not shrink proportionately because a business has 20 employees rather than 200; the smaller firm spreads the burden across less GVA and less management capacity. The appropriate measure is:
Capability Burden (CB) = minimum required capability cost ÷ GVA
GVA is the correct denominator, not revenue. A £20 million distributor creating a narrow value-added margin cannot absorb overhead the way its turnover implies, while a £3 million professional practice with high internal value creation can. The burden also includes organisational friction: executive time, data preparation, duplicated control during transition, retraining, and lost productive capacity while change occurs.
The 2024 Business Perceptions Survey reported businesses spending an average of eight working days per month on compliance, up from 6.6 days in 2022, with most reporting increased time or financial burden [S23]. Technology can lower parts of the floor and raise it simultaneously: fewer people producing routine reports, but stronger requirements for data governance, access control, vendor management, independent verification and recovery planning. A cheaper tool can coexist with a more expensive operating standard.
6.1 Acquisition is not integration
Technology access ≠ integrated operating capability
Capability exists only when technology is connected to reliable data, clear process ownership, controls, exception handling, evidence, accountability and recovery. The Business Data Survey quantifies the gap [S15]. Large firms spread integration, security and process design across thousands of transactions; a smaller firm pays more per unit of activity even when the licence fee is identical. The floor differs by architecture — maintenance and operational-technology security in manufacturing; inventory visibility, customs and credit control in distribution; evidence quality and professional liability in services; model governance and continuous technical renewal in digital firms — but it rises, unevenly, for nearly everyone.
7. The Second Constraint: The Independent Capital-Formation Gap
The second constraint is the inability of many SMEs to finance productive transformation from retained cash, suitable long-term debt or independent equity without accepting excessive short-term risk, dilution or dependency. This is not a credit gap. It is a capital-formation gap:
Finance availability ≠ transformation financeability
A firm may borrow against invoices or lease a vehicle. That does not finance process redesign, management capacity, data preparation, system integration, implementation losses and the liquidity buffer required before benefits mature. The complete requirement is:
Transformation Funding Requirement = CapEx + implementation cost + additional working capital + transition loss + resilience buffer − internally available cash
A modern capability investment must clear a composite hurdle: finance cost plus implementation risk, obsolescence risk, liquidity risk and dependency risk. The last two dominate for SMEs. A project can be NPV-positive and still destroy the firm if its cash requirements arrive before its benefits, or improve efficiency while deepening exposure to a single provider whose terms the business cannot influence.
The Bank of England's July 2026 Financial Stability Report found SME cash buffers down from recent highs, smaller and more leveraged firms more exposed to refinancing and cost pressure, and borrowing for investment subdued, alongside structural frictions such as slow application processes and reduced relationship banking [S24]. The Bank's regional Agents reported uneven investment intentions and selective lender appetite, particularly in construction and hospitality; asset finance and invoice discounting were growing, supporting specific assets and cash cycles but not the long-horizon transformation problem [S25]. Collateral asymmetry compounds this: asset-light firms scale when equity is abundant and stall when risk appetite falls, while asset-heavy firms hold collateral but lack the free cash flow to modernise it. The cost of independence therefore includes the cost of financing without surrendering strategic control.
8. Labour: Fewer Replacements, Different Roles, More Capability per Person
The labour market through 2028 is likely to combine weakness and scarcity: falling aggregate vacancies, softer payroll employment and higher unemployment alongside persistent shortages in technical, regulated, physical and care roles [S12] [S13]. The contradiction is rational, because the market does not clear as one pool. A decline in administrative vacancies does not create qualified engineers, nurses or machine operators.
The National Living Wage rose to £12.71 in April 2026, with the 18-to-20 rate rising faster [S26]. Statutory floors improve worker income while creating direct pressure in low-margin, labour-intensive sectors where productivity cannot rise quickly and prices are constrained by consumers, public contracts or prime contractors — an effect visible in the site-operator and consumer architectures in Section 11.
The most probable adjustment is layered rather than dramatic: reduced replacement hiring; consolidation of administrative roles into broader software-supported jobs; longer retention of experienced people whose knowledge is hard to codify, supported by falling inactivity among those aged 50 to 64 [S14] [S27]; rising output expectations per retained employee; and a changed failure profile, since removing people lowers normal operating cost while eliminating the competence needed to challenge automated outputs and recover when systems fail. The useful question is not how many jobs AI removes. It is which activities are absorbed, which responsibilities remain, and how much human recovery capacity must be retained.
9. Technology: Fast Capability, Slow Economic Conversion
AI capability is advancing quickly. Stanford's 2026 AI Index reports rapid improvement on reasoning, coding and agentic benchmarks, convergence among leading US and Chinese models, and continuing growth in global compute — alongside a jagged frontier of systems that excel on difficult benchmarks while remaining unreliable on apparently simple tasks [S28] [S49]. Economically, capability arrives unevenly by task, reliability requirement, context and cost. The frontier is not a smooth replacement curve.
Deployment depends on the physical economy. The United States leads private AI investment and data-centre infrastructure; China combines strong model performance with manufacturing scale — 54% of global industrial robot installations in 2024 — state-supported infrastructure and deliberate integration of AI with industry through 2028 [S29] [S30] [S31] [S51]. These indicators do not establish either national model as superior. They show that technological power has several dimensions — models, compute, capital, semiconductors, electricity, robotics, deployment, supply-chain control — which any credible comparison must keep separate [S50].
Corporate abundance theses are treated here as scenario evidence: they shape investment and policy, but they are not proof that abundance will be accessible, autonomous or evenly distributed [S32] [S33] [S34]. Productive abundance is not the same as accessible abundance. Output can rise while access is rationed through price, platform rules, identity, credit or technical standards. The unresolved variables are ownership, allocation, access, concentration and transition.
For UK SMEs through 2028 the practical implication is modest. AI will improve many cognitive and administrative processes, but the strongest gains will occur where the business already holds clean data, repeatable workflows, management capacity, physical complements and finance. Elsewhere, tool adoption will run well ahead of economic conversion.
10. The 2028 Operating Forecast
The 2028 horizon is close enough for bounded forecasting. Existing investment programmes, lending structures, wage policy, grid projects, demographic trends and adoption data provide a reasonable basis for identifying the likely environment. Each forecast carries a calibrated confidence level as defined in Section 1.1, conditional on the stated assumption set: no new pandemic-scale shock, no direct major-power conflict involving the UK, no disorderly sovereign or banking crisis. Each is tied to at least one dated signpost in Section 15.
Forecast 1 — Optimisation becomes mandatory; indiscriminate cost-cutting becomes more dangerous
Conditional forecast. Confidence: High (≥80%). Signposts SP1, SP2.
Low real growth and elevated cost levels leave less room to hide inefficient processes inside nominal revenue expansion. Many businesses have already removed the obvious slack, so further reduction increasingly touches maintenance, liquidity, training, provider diversity and experienced staff. The management question shifts from how to reduce cost to which cost protects the system from failure. A manufacturer that removes the only alternative machine able to cover a breakdown converts a saving into a larger expected failure cost; a practice that automates review without retaining competent challenge buys nominal efficiency with liability risk.
Forecast 2 — The capability floor rises faster than many firms can absorb
Conditional forecast. Confidence: High (≥80%). Signposts SP9, SP11.
Cybersecurity, data governance, compliance, evidence, integration and specialist oversight continue to behave as fixed or semi-fixed costs. Tools may get cheaper while the required operating standard rises. The burden is regressive, since high-value-density businesses spread it across more GVA, and it drives three responses: consolidation, dependency on managed platforms, and cooperative sharing of specialist capability.
Forecast 3 — Finance remains available; independent transformation capital remains scarce
Conditional forecast. Confidence: High (≥80%). Signposts SP3, SP12.
SME lending will not disappear. Specialist banks, asset finance, invoice finance and embedded products remain active [S11] [S25]. The constraint is patient, appropriately matched capital that funds organisational transformation rather than only assets or short-term liquidity. Firms with strong collateral, recurring revenue and clear cash conversion obtain better terms; firms with volatile demand, intangible assets or customer concentration face wider spreads, more security, or dependence on equity and platform finance. The result is selective transformation — which the model in Section 11 shows in cash terms.
Forecast 4 — Labour adjusts through attrition and redesigned work, not one redundancy wave
Statistical inference and conditional forecast. Confidence: Medium-high (65–80%). Signposts SP5, SP6.
Falling vacancies and cautious hiring suggest most firms absorb change through reduced replacement recruitment, redistribution and automation of routine tasks, and retention of experienced workers where judgement and recovery resist codification. Headcount may fall or stay flat while required capability per employee rises: fewer narrow task executors, more people able to supervise systems, manage exceptions and connect digital output to physical reality.
Forecast 5 — Technology access broadens faster than deep integration
Conditional forecast. Confidence: High (≥80%). Signpost SP9.
Generative tools become ordinary business utilities, while deep integration into finance, operations, manufacturing and supply chains stays slower, bottlenecked by data quality, process fragmentation, security, legacy systems, physical compatibility and management bandwidth. This accelerates divergence within sectors: a disciplined 40-person firm with connected data and strong cash conversion can outperform a fragmented 300-person business. Size matters; architecture matters more.
Forecast 6 — Physical deployment becomes the limiting factor in many sectors
Conditional forecast. Confidence: High (≥80%). Signposts SP7, SP8.
The software layer advances faster than industrial assets, grids, buildings and logistics [S04] [S05]. Capital-intensive SMEs receive incremental rather than transformational gains unless they can finance physical integration: manufacturing benefits from design assistance, scheduling and predictive maintenance, but the largest productivity step usually requires sensors, connectivity, robotics, re-layout and new equipment. Construction and care automate administration faster than physical delivery; agriculture improves monitoring while remaining governed by land, weather, machinery and biological cycles.
Forecast 7 — Platform dependency expands faster than independent alternatives
Conditional forecast. Confidence: Medium-high (65–80%). Signpost SP10.
Dominant platforms offer immediate advantages: low upfront cost, existing distribution, mature security, integrated payments and rapid access to advanced capability. For many SMEs, dependent scale is simply easier to acquire than independent architecture. The number of legally independent businesses may stay high while effective independence declines, as platform fees, cloud commitments, customer intermediation and data lock-in become larger components of the cost structure. The risk is not participation. It is the absence of credible exit. This forecast concerns the direction of travel over 2026–2028; it is not a claim about which structural state dominates in 2031.
Forecast 8 — Insolvency and attrition concentrate in structurally disadvantaged models
Observed fact and conditional forecast. Confidence: Medium-high (65–80%). Signpost SP4.
The Insolvency Service recorded 50.5 company insolvencies per 10,000 active companies in the twelve months to June 2026 — below the previous year but elevated against the low-rate period [S35]. Risk concentrates where low pass-through power, high working-capital intensity, short debt maturities, narrow cash buffers, customer concentration, fixed-price contracts and a rising capability burden combine: retail, hospitality, subcontract construction, lower-value distribution and energy-intensive production. Weak businesses can also survive for long periods through owner support, payment delay and underinvestment, so the visible insolvency rate understates broader economic attrition.
11. The Quantified Cost of Viability, 2026–2028
This section answers the central question in numbers. Seven calibrated operating architectures are run through a driver-based model with correlated uncertainty. The firms are transparent test architectures, not statistical averages of their sectors: no public dataset supports a claim of representativeness [S55] [S56], and none of the outputs is an econometrically estimated coefficient. The material assumptions required to interpret the results are disclosed here; complete numerical reproduction depends on the accompanying model file, assumptions schedule, correlation matrix and fixed seed.
11.1 What “the cost of viability” means
The cost of viability is the additional revenue, contribution, working capital and financing required to preserve a defined economic condition. The condition must be stated, because preserving nominal profit, preserving the margin percentage, preserving liquidity and retaining replacement capacity are progressively harder tests. The model addresses three: solvency, meaning obligations met as they fall due; development capacity, meaning maintenance and capability renewal funded without exhausting liquidity; and strategic independence, meaning credible alternatives and exit capacity retained.
Projected cost₍2028₎ = Σₖ cost₍k,2026₎ × (1 + gₖ)² × (1 + vₖ · volume growth)² + debt × blended 2028 rate
Required revenue₍2028₎ = projected cost₍2028₎ ÷ (1 − base-year margin)
Additional working capital = (required revenue − base revenue) × working-capital intensity
Achieved selling-price growth = pass-through coefficient η × weighted input-cost growth
The activity term in the cost equation matters and is often omitted from simple inflation models: costs rise both with input prices and with activity. Each category carries a disclosed variability factor vₖ — materials fully variable at 1.00, payroll 0.60, energy 0.50, other cash costs 0.40, software and compliance 0.20 — so that growth itself carries a cost. The pass-through coefficient is equally consequential: the revenue a firm needs to preserve its margin is not necessarily the revenue the market will grant it. Annual price and volume effects are applied sequentially over the two-year horizon; interest is calculated separately from operating cost, while maintenance capex remains outside operating cost and enters the cash and debt-service tests.
11.2 Driver assumptions and dependence structure
Each annual driver is a truncated normal distribution anchored to the cited series, with the residual range disclosed as judgement. A Gaussian copula imposes the dependence structure, because adverse states arrive together: wages with energy and materials, refinancing rates with weaker demand, energy with input costs. Independent draws would materially understate joint stress.
| Annual driver | Mean | Indicative 80% range | Truncation | Anchor |
| Payroll and statutory costs | 4.2% | 2.9% – 5.5% | 2% – 7% | S26, S12 |
| Energy and facilities | 2.0% | −4.4% – 8.4% | −8% – 14% | S07, S08 |
| Software, compliance and IT | 10.0% | 6.2% – 13.8% | 4% – 18% | S15, S23 |
| Purchased inputs and materials | 2.5% | 0.6% – 4.4% | −2% – 7% | S16 |
| Other cash operating cost | 2.5% | 1.2% – 3.8% | 0% – 6% | S16 |
| Refinanced debt rate (level) | 6.2% | 5.2% – 7.2% | 4.5% – 8.5% | S09 |
Two further parameters vary by architecture and are shown in Table 11.2: annual volume growth, and the pass-through coefficient η drawn uniformly across a disclosed range. Neither is presented as an estimated UK sector coefficient. Both are carried as ranges because pricing power, contract structure and customer concentration are decisive but incompletely observed in public data.
11.3 The seven calibrated architectures
| Architecture | Revenue | Base margin | Payroll | Inputs | WC int. | Maint. capex | Volume p.a. | η range |
| Precision manufacturer | £8.0m | 11.0% | 38% | 34% | 18% | £280k | 0.5% | 0.35–0.65 |
| Wholesale distributor | £20.0m | 3.1% | 12% | 78% | 12% | £80k | 1.0% | 0.55–0.85 |
| Professional practice | £3.0m | 15.4% | 62% | 0% | 12% | £30k | 1.5% | 0.50–0.80 |
| Digital-native technology service | £5.0m | 18.0% | 50% | 2% | 8% | £180k | 6.0% | 0.55–0.85 |
| Labour-intensive site operator | £12.0m | 6.5% | 58% | 20% | 16% | £120k | 1.0% | 0.35–0.65 |
| Discretionary consumer business | £6.0m | 4.5% | 36% | 30% | 10% | £90k | 0.0% | 0.30–0.60 |
| Land-based biological producer | £4.5m | 9.0% | 22% | 38% | 24% | £250k | 0.5% | 0.25–0.55 |
Software and compliance shares run from 1.5% of operating cost in distribution to 22% in the digital service; energy from 1% to 10%. Debt is calibrated so that each firm begins 2026 with a defensible debt-service cover: 2.41× for the manufacturer, 3.42× for the distributor, 11.51× and 7.20× for the practice and digital service, 2.08× for the site operator, and 1.32× and 1.23× for the consumer business and land-based producer. The last two are deliberately tight, consistent with the Bank of England's finding of reduced cash buffers and greater refinancing exposure among smaller, more leveraged firms [S24].
The baselines are intentionally unlike each other. Turnover is a poor guide to the capacity to absorb the capability floor: the £20 million distributor creates less discretionary value than the £3 million professional practice. Working-capital intensity, maintenance requirement, debt structure and pass-through power determine how quickly a manageable-looking cost increase becomes a liquidity or renewal problem.
11.4 Results
Each architecture is run through 100,000 correlated states. P10, P50 and P90 are the 10th, median and 90th percentiles. The probabilities are frequencies within the disclosed simulation architecture; they are not observed population failure rates.
Interpretation note. “Required revenue growth” is the revenue path needed to preserve the starting margin under each architecture’s assumed volume path. For the six lower-growth architectures it approximates the cost of maintaining position; for the digital service it includes the cost of financing materially faster activity growth. The two cases should therefore be compared as architecture-specific viability requirements rather than as identical no-growth scenarios.
| Architecture | Required revenue growth P10/P50/P90 | 2028 margin P10/P50/P90 | Median add. WC | Median comp. | P(loss) | P(DSCR<1) | P(>2pp comp.) |
| Precision manufacturer | 3.4 / 7.6 / 11.9% | 6.0 / 8.3 / 10.4% | £109k | −2.7pp | 0.0% | 9.5% | 66.3% |
| Wholesale distributor | 1.0 / 7.5 / 14.2% | 0.3 / 1.8 / 3.1% | £180k | −1.3pp | 6.7% | 20.4% | 26.4% |
| Professional practice | 6.6 / 10.2 / 13.8% | 11.8 / 14.2 / 16.5% | £37k | −1.2pp | 0.0% | 0.0% | 32.6% |
| Digital-native technology service | 10.6 / 16.5 / 22.6% | 16.2 / 20.7 / 24.6% | £66k | +2.7pp | 0.0% | 0.0% | 9.0% |
| Labour-intensive site operator | 4.1 / 8.8 / 13.6% | 1.0 / 3.9 / 6.5% | £168k | −2.6pp | 4.3% | 33.4% | 61.2% |
| Discretionary consumer business | 1.1 / 6.6 / 12.2% | −2.3 / 1.1 / 4.2% | £39k | −3.4pp | 32.6% | 80.4% | 70.6% |
| Land-based biological producer | 0.5 / 6.9 / 13.6% | 2.2 / 5.9 / 9.3% | £75k | −3.1pp | 2.4% | 71.8% | 65.4% |
11.5 Reading the seven architectures
Precision manufacturer. Outright loss is negligible, but margin compresses by 2.7 points at the median and by more than two points in two cases out of three, while debt-service cover falls below 1.0× in roughly one case in ten. The £109,000 of growth-absorbed working capital and £280,000 of maintenance capex consume exactly the cash a modernisation programme would need. The firm survives while becoming progressively less able to renew its productive base — the clearest illustration of Forecast 3.
Wholesale distributor. The widest cost range of the set, at 1.0% to 14.2%, because 78% of its cost base is purchased goods. Median margin falls from 3.1% to 1.8%, and the loss probability of 6.7% understates the real problem: at this margin the firm has almost no distance between ordinary volatility and difficulty, and growth consumes £180,000 of working capital — the largest absolute figure in the set. Revenue can rise while liquidity deteriorates.
Professional practice. Solvency is not in question. Its fastest-growing line is software and compliance, and the strategic risk is drift rather than failure: professional surplus migrates gradually toward software, model and infrastructure providers. Customer ownership, trusted judgement and data portability matter more here than cost control.
Digital-native technology service. The only architecture whose median margin improves, by 2.7 points, through operating leverage on an assumed 6% annual volume-growth path. The 16.5% median required-revenue result is therefore not a pure “standing still” measure: it is the revenue needed to preserve the 18% starting margin while financing that growth path. Its exposure is strategic — infrastructure rent, obsolescence and customer-acquisition concentration — rather than near-term solvency.
Labour-intensive site operator. Wage floors, physical delivery, contract rigidity and weak short-run labour substitutability combine with high working-capital demand. Debt-service cover falls below 1.0× in a third of simulations and margin compresses by more than two points in six cases out of ten. Administrative automation helps at the edges; it does not touch the physical and contractual core of delivery.
Discretionary consumer business. The weakest architecture modelled. A 4.5% starting margin, consumer price sensitivity, and wage and occupancy exposure leave almost nothing between normal volatility and loss: a 32.6% probability of an operating loss and an 80.4% probability of debt-service breach. Liquidity, differentiation and local pricing power dominate everything else in this case.
Land-based biological producer. The most instructive divergence in the model: only a 2.4% probability of an operating loss, but a 71.8% probability of debt-service breach. Seasonal cash flow, high working-capital intensity, machinery replacement and biological volatility mean valuable land and equipment do not produce operating liquidity. Collateral and cash generation are different things, and lenders test the second.
11.6 What the model shows, and what it does not
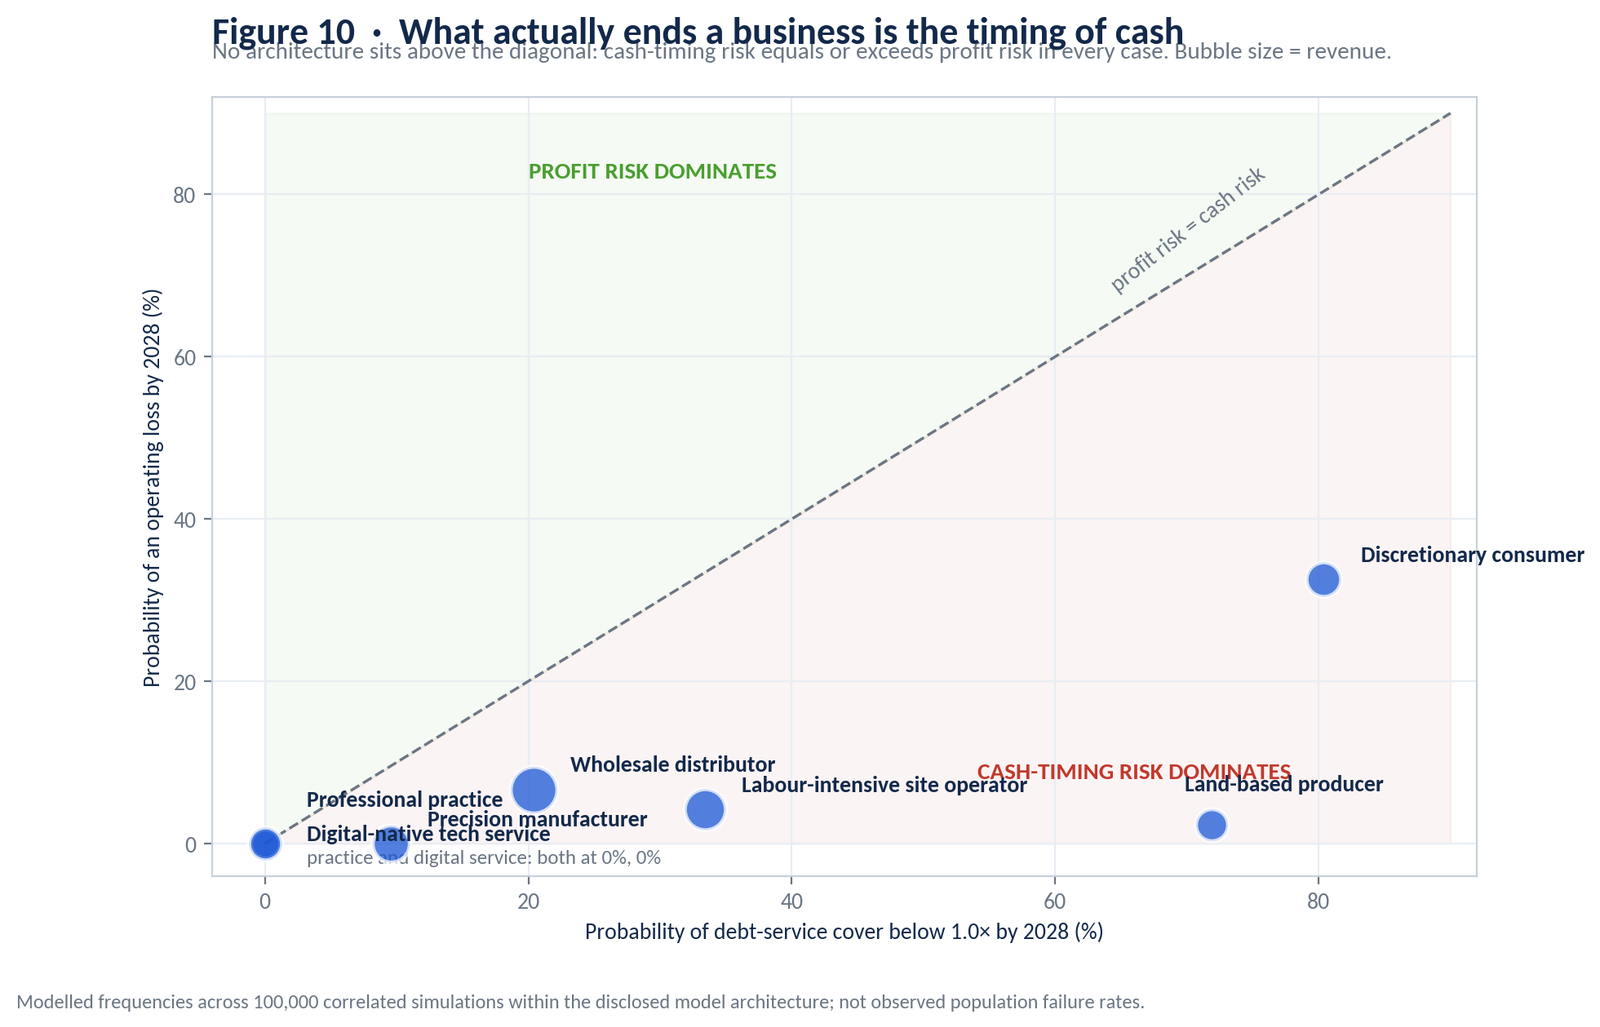
Across all seven cases, software, compliance and IT is usually the fastest-growing line in percentage terms, but the largest absolute pressure follows the architecture: payroll in labour-heavy firms, purchased inputs in distribution and production, and maintenance and biological volatility in physical systems. Debt-service breach is a more common failure mode than operating loss in four of the seven cases. Neither pattern is visible from turnover or headcount, which is the central point: the constraint is architecture, not the administrative SME label.
Debt-service cover is interpreted as cash available for debt service after operating cash effects, additional working-capital absorption and maintenance capex, divided by interest plus scheduled principal. Tax, owner distributions, growth capex and exceptional shocks are excluded from the two-year model. Accordingly, the reported breach frequencies are best read as timing and financing stress within the disclosed architecture, not as direct insolvency probabilities.
The limits are equally clear. The seven firms are calibrations, not population estimates. Driver means, correlations, variability factors and pass-through ranges are disclosed judgements anchored to cited evidence, not estimated parameters. Tax, owner distributions, growth capex and exceptional shocks are excluded by design, which makes the model conservative in some respects and optimistic in others. Monte Carlo simulation maps uncertainty through the chosen model; it does not remove model risk. The value of the exercise lies in making the financial mechanics visible and the assumptions changeable, so that any reader can substitute their own and re-run the result.
12. The Safe Optimisation Frontier
Optimisation creates value only until further reduction begins to remove necessary redundancy, liquidity, human competence, provider diversity, independent verification, recovery capacity or participant viability. Beyond that point apparent efficiency becomes destructive. The decision rule is:
Continue optimisation only while marginal economic benefit > marginal dependency cost + expected failure cost + recovery cost
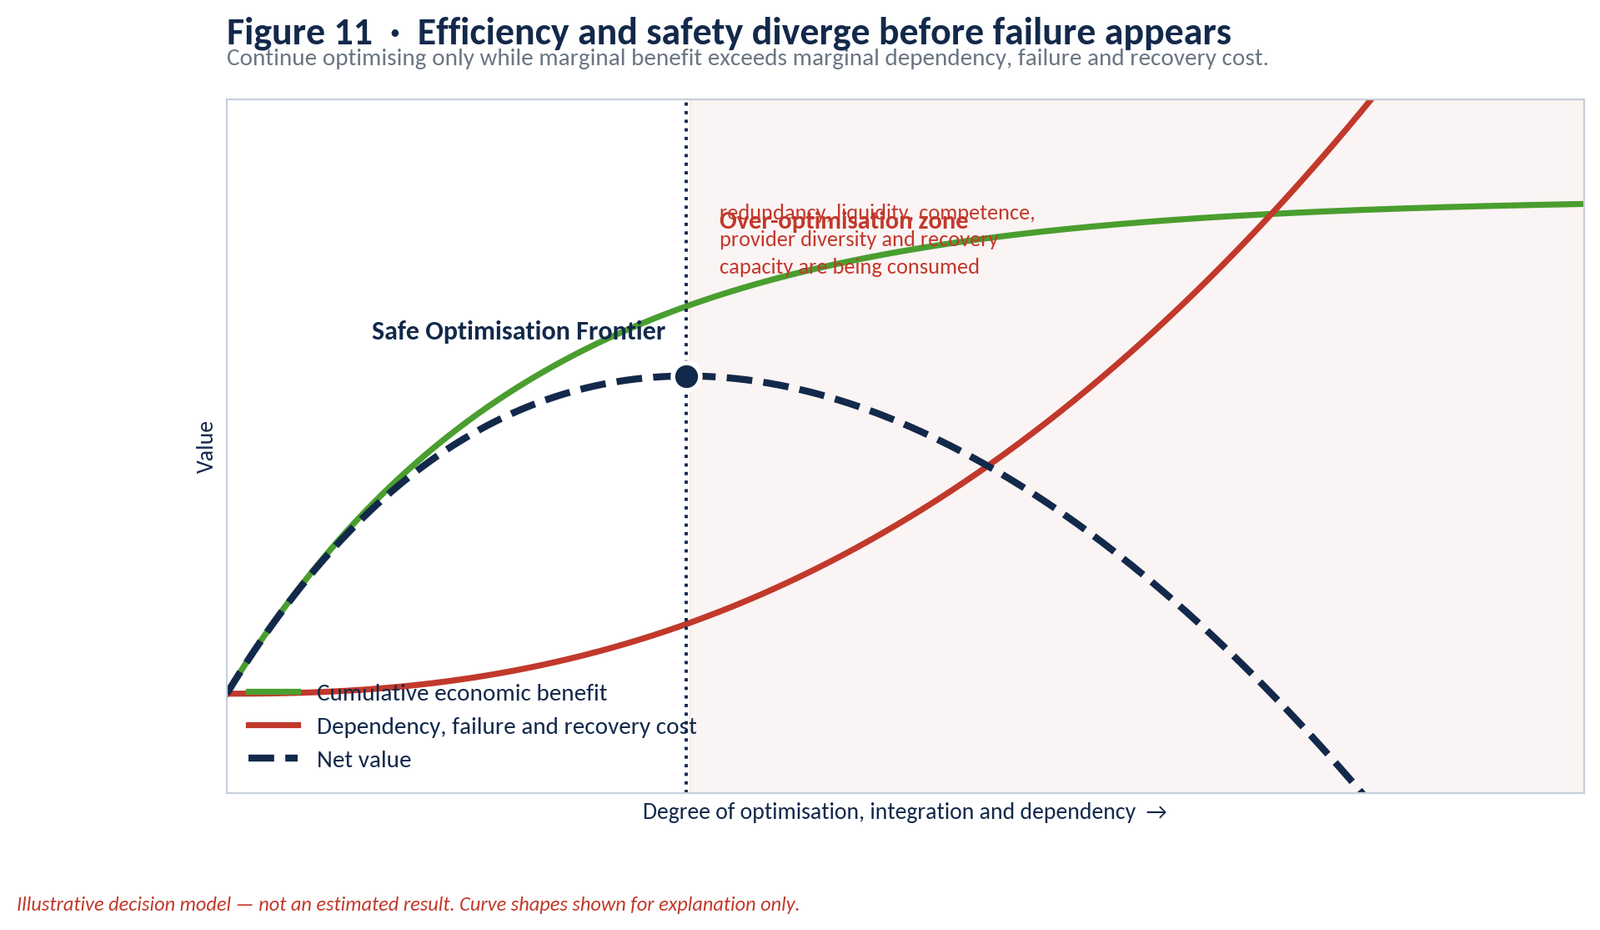
Centralisation can be efficient and unsafe at the same time. It lowers normal operating cost by concentrating infrastructure and expertise while increasing common-mode failure: if thousands of firms depend on the same cloud region, payment rail or identity system, one interruption reaches many nominally independent businesses simultaneously. The same logic operates inside the firm — one integrated system, one specialist, one anchor customer. The answer is not full duplication, which is expensive and often degrades quality, but a polycentric structure: shared scale, distributed ownership, independent verification, provider diversity and local recovery. Provider count must not be confused with provider diversity; ten software suppliers hosted in one cloud region are ten contracts and one failure domain.
A firm has crossed the frontier when it cannot answer the recovery questions. Can it process critical transactions if the main platform is unavailable? Recover its data in usable form? Field an experienced person able to challenge an automated output? Continue if an anchor customer pays 30 days late? Replace a provider without risking insolvency? Resilience is not idle waste. It is productive capacity reserved for adverse conditions, and the model in Section 11 prices what happens when it is absent.
13. The 2031 Structural Horizon
13.1 Two axes, four states
The structural states are generated by two axes. The first is concentration of operating control: who holds effective power over customers, data, payments, software and standards, running from concentrated gatekeeping to distributed, polycentric coordination. The second is the pace of physical technology deployment: how quickly AI-era capability is embodied in energy, equipment, robotics and infrastructure, running from constrained to rapid. The four states occupy the quadrants. They may coexist across sectors, regions and even within one company, and no probability is assigned to any of them.
| Structural state | Position on axes | Defining condition |
| Platform-dependent tenant economy | Concentrated control × rapid deployment | Capability advances quickly while control stays concentrated; SMEs exchange autonomy for access. |
| Symbiotic scalability | Distributed control × rapid deployment | Independent firms share selected fixed capabilities and capital structures while retaining ownership, customers and exit. |
| Fragmented attrition | Concentrated or mixed control × constrained deployment | Physical bottlenecks and capital costs prevent renewal; partial tools sit over ageing manual cores. |
| Modular niche autonomy | Distributed control × selective deployment | Specialists retain differentiation and customer control while buying reversible, modular external services. |
13.2 The states in practice
A firm becomes a tenant when it cannot economically move its data, customers, workflow or revenue elsewhere. That relationship can begin mutualistic, become asymmetric as switching costs rise, and turn extractive if the platform captures most incremental surplus. The likely survivors hold scarce physical capability, proprietary IP, trusted direct relationships or local access the platform cannot reproduce. The vulnerable are undifferentiated intermediaries whose customer access and operating systems are both externally controlled.
Under symbiotic scalability the purpose of cooperation is not to build another dominant platform but to overcome minimum-efficient-scale constraints without converting participants into tenants: engineering firms sharing metrology, testing or robotic cells; practices sharing secure infrastructure and specialist compliance; agricultural businesses sharing machinery, storage and financeability structures. Section 14 sets out the conditions under which this works.
Under fragmented attrition, low-margin businesses continue to exit; medium-sized firms acquire smaller competitors for customers and capacity rather than innovation; owners postpone maintenance to protect cash; and the business population stays numerically large while becoming less capable. The survivors are cash-rich, low-debt operators with local pricing power or durable physical assets.
Under modular niche autonomy the successful SME does not internalise everything. It retains high-differentiation capability and customer control while buying reversible, modular, competitively supplied external services, supported by deep domain knowledge, direct client relationships, strong cash conversion and low dependency concentration. A related form may emerge around public procurement and regulated services, where mature compliance systems create defensible positions while the capability floor deters new entrants: stability improves, dynamism weakens.
13.3 The likely mosaic
The realistic 2031 outcome is a mosaic rather than a resolution. Platform dependency probably expands fastest, because onboarding is simple and immediate. Symbiotic structures emerge only where the economic pain of isolation is large enough and participants hold sufficient professional capability, trust and governance capacity. Fragmented attrition persists in low-margin, capital-constrained sectors. Modular autonomy remains viable where firms hold genuine differentiation and credible alternatives. The decisive variable is not firm size. It is the location of control over customers, data, capital, physical assets and recovery.
14. Shared-Capability Consortia: Scale Without Surrender
Cooperation is one possible structural response, not a prediction. It remains an unresolved hypothesis until operating consortia produce governance and outcome evidence. It should also not be confused with a referral network, purchasing club or informal alliance. A structure capable of altering the outcomes in Section 11 would have to reproduce much of what a large corporation provides — specialist management, financial control, quality assurance, secure data infrastructure, procurement scale, capital formation, development capacity, resilience and internal resource circulation — while differing in one respect: ownership and control stay distributed. Member firms retain customers, data, brands and strategic identity while operating on common standards, interoperable systems and modular shared capability.
14.1 Functions the structure must deliver
| Function | Business expression |
| Productive capacity | Raises GVA, productivity, utilisation and cash conversion for members. |
| Shock absorption | Reduces transmission of shocks, expected loss and recovery time. |
| Safe operating environment | Provides secure infrastructure, evidence, compliance and continuity. |
| Development and renewal | Supports skills, succession, innovation, investment and asset replacement. |
| Capability provision | Meets the Minimum Capability Floor for each participant at lower unit cost. |
| Exchange and coordination | Enables joint projects, procurement, capacity transfer and co-investment. |
| Resource circulation | Matches surplus cash, labour, assets, knowledge and capacity with internal need. |
| Diversity and redundancy | Maintains genuine alternatives and avoids common-mode dependence. |
| Sensing and adaptation | Provides shared intelligence, early warning and coordinated response. |
These functions require a professional operating backbone: an integrated management system, a quality framework, common financial and operational evidence, secure communication, transparent cost and usage allocation, resource-matching mechanisms, financeability support, independent assurance, and credible dispute, default and exit procedures. Accounting, finance, legal, technology and operational firms are the natural builders of that layer, because they already hold the evidence standards and client relationships it depends on. The infrastructure used to run it must itself remain modular, portable and competitively supplied; a consortium that solves platform dependency by creating a new gatekeeper has solved nothing.
14.2 The two tests
The economic test is whether cooperation creates more value, capacity, liquidity and resilience than it consumes in integration, governance and dependency:
Net structural advantage = ΔGVA + fixed capability cost avoided + utilisation gain + working-capital release + financeability gain + risk loss avoided + option value − integration cost − governance cost − dependency rent
An aggregate positive result is not sufficient. Every essential participant must obtain positive long-term value and remain liquid throughout transition, because a structure that generates large aggregate savings while weakening smaller members is not symbiotic — it is a slower form of consolidation. The independence test is whether exit remains executable:
Exit Capacity Ratio = replacement and transition capacity ÷ estimated cost of leaving
A ratio above one indicates credible exit; around one, fragile independence; below one, practical lock-in even where legal ownership is intact. The thresholds are decision conventions rather than natural constants. Their value is in forcing migration, duplicate operation, customer reacquisition, contractual penalties and transition liquidity to be costed at all, rather than assumed away.
14.3 The scale question
Shared capability is not free, and the arithmetic sets the entry price. Permanent professional capacity — specialist management, assurance, secure infrastructure, development and resilience — is a fixed cost that must be funded from a levy on aggregate member value added without becoming a burden that outweighs the benefit. At a 1% allocation, the relationship is simply:
| Aggregate annual GVA | 0.25% | 0.50% | 1.00% | 1.50% |
| £1bn | £2.5m | £5m | £10m | £15m |
| £3bn | £7.5m | £15m | £30m | £45m |
| £5bn | £12.5m | £25m | £50m | £75m |
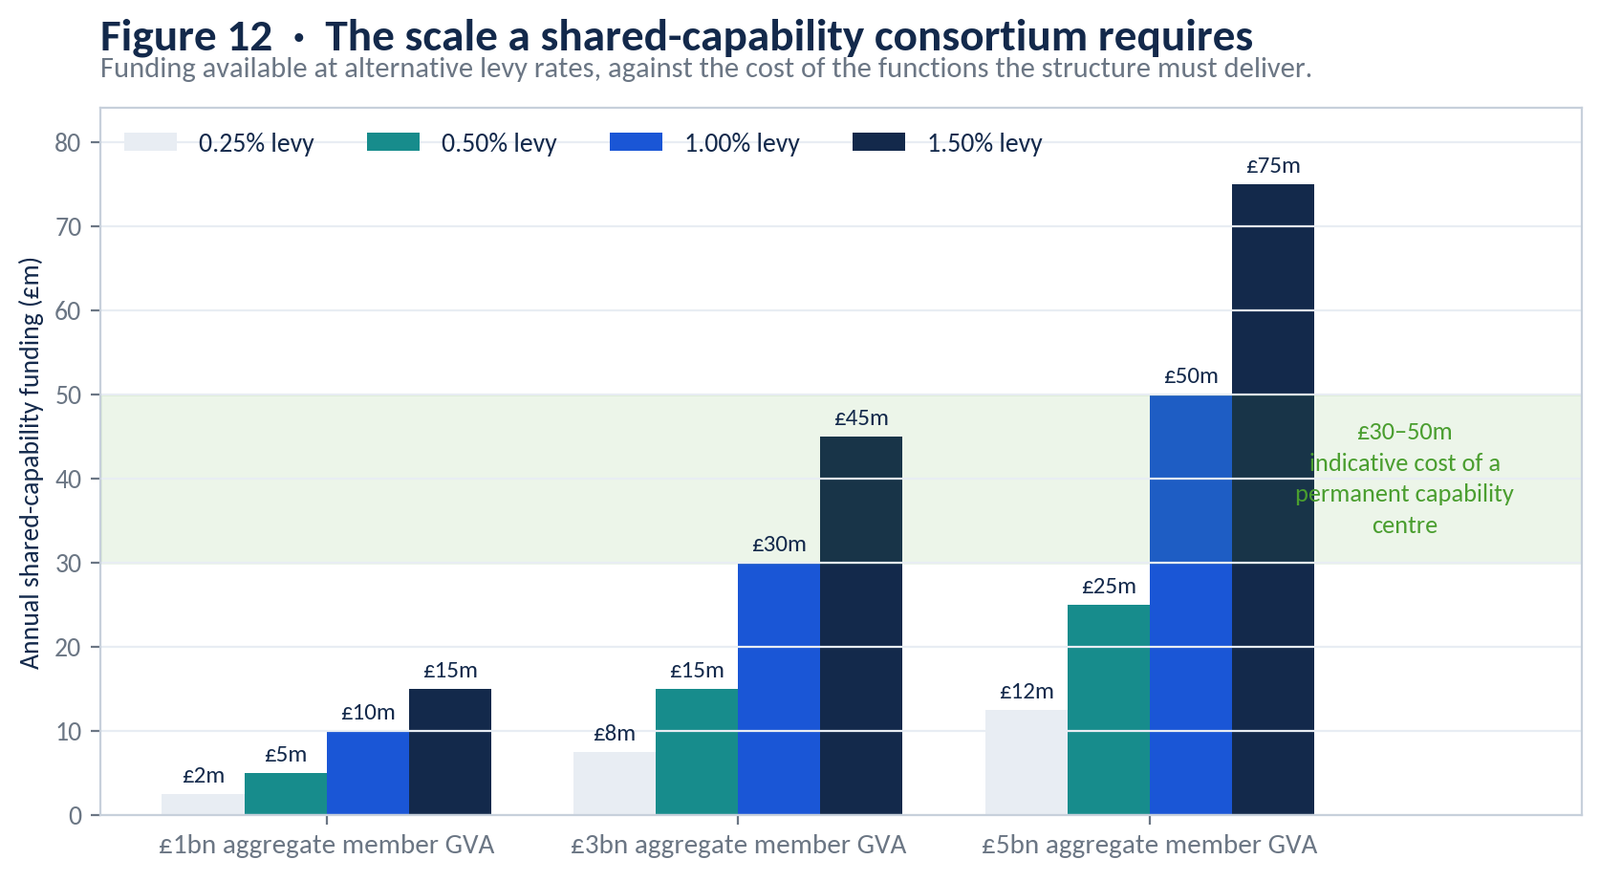
The implication is arithmetic rather than assertion. A permanent capability centre of the scale implied by the functions in Table 14.1 — comparable in breadth to the corporate centre of a substantial group — could plausibly require a recurring budget in the order of £30–50 million a year. Funding that from a 1% levy therefore implies aggregate member GVA in the range of £3–5 billion. Below roughly £1 billion of aggregate GVA, the structure is more likely to support a professional nucleus than a complete corporate-scale capability centre. As scale rises, economic capacity improves, but so do coordination, capture and concentration risks; the viable range is therefore bounded by both minimum functional scale and maximum safe centralisation. This remains an order-of-magnitude calibration requiring a dedicated functional-cost model rather than an empirically validated threshold.
The £30–50 million range should be decomposed in future work into professional staffing, management and quality systems, secure data and communication infrastructure, independent assurance, development capability, market and procurement coordination, resilience reserves and the operating cost of resource-matching mechanisms. Until that functional-cost model is completed, the range should be treated as a planning envelope rather than a point estimate.
14.4 Capability disposition and governance
A member should not share everything. High-differentiation, low-capital capability — proprietary methods, direct customer relationships, core data — stays internal. High-differentiation, high-capital capability — laboratories, advanced compute, specialist testing equipment — may justify joint ownership. Low-differentiation, high-capital capability can be leased or pooled where markets are competitive and exit is real. Low-differentiation, low-capital activity is simplified or automated. A third test always applies: a capability may be non-differentiating and still too critical to place under an irreversible monopoly.
Governance is not an administrative appendix; it is where these structures fail. Free-riding, unanimity paralysis, capture by the largest participant, information leakage through shared data standards and undeclared cross-subsidy will each destroy a consortium. The requirements are transparent usage measurement, proportional but bounded voting, reserved matters, independent assurance, protected data domains, default procedures, transition-liquidity rules and credible exit rights. Resilience in such a structure comes from diversity and interconnection, not from a central controller.
15. Signposts: How to Score This Forecast
A forecast that cannot be scored is commentary. Each signpost below is a specific, observable statement with a named resolution source and date. At each date the outcome will be published together with the running accuracy of the set, including a Brier score against the confidence bands in Section 1.1. The signposts are chosen to test the forecast where it could fail, including where a wrong call would be commercially inconvenient.
| ID | Statement to be scored | Resolution source | Resolve by | Conf. |
| SP1 | UK annual real GDP growth for 2027 (first full estimate) falls between 0.8% and 2.2%. | ONS quarterly national accounts [S37] | Mar 2028 | High |
| SP2 | CPI 12-month rate is between 1.5% and 3.0% in at least 9 of the 12 months of 2027. | ONS CPI series [S36] | Jan 2028 | High |
| SP3 | Effective rate on new SME bank lending remains between 4.5% and 7.0% at June 2028. | Bank of England effective rates [S09] | Aug 2028 | High |
| SP4 | Company insolvencies per 10,000 active companies (12-month rate) are between 42 and 56 at June 2028. | Insolvency Service [S35] | Jul 2028 | Med-high |
| SP5 | Aggregate UK vacancies remain below their 2019 pre-pandemic average throughout 2027. | ONS vacancies [S13] | Jan 2028 | Med-high |
| SP6 | The National Living Wage for April 2028 is at least £13.30. | GOV.UK statutory rates [S26] | Nov 2027 | Med-high |
| SP7 | Average non-domestic electricity prices remain at least 40% above their 2020 level in the latest 2027 data. | DESNZ price statistics [S08] | Mar 2028 | High |
| SP8 | Median connection time for new large industrial demand remains above 2 years despite queue reform. | NESO / DESNZ reporting [S05] [S06] | Jun 2028 | Med-high |
| SP9 | The next Business Data Survey shows an AI-integration gap of at least 15 percentage points between large and small firms. | DSIT Business Data Survey [S15] | On publication | High |
| SP10 | The top three providers hold at least 60% of the global cloud infrastructure market in the latest 2027/28 estimate. | UNCTAD / market estimates [S20] [S52] | Jun 2028 | High |
| SP11 | The next Business Perceptions Survey shows average compliance time of at least 7.5 working days per month. | DBT Business Perceptions Survey [S23] | On publication | Med-high |
| SP12 | Gross SME bank lending grows year-on-year while unsecured term lending beyond 5-year maturity remains a minority of new SME facilities. | British Business Bank / BoE [S09] [S11] | Mar 2028 | Med-high |
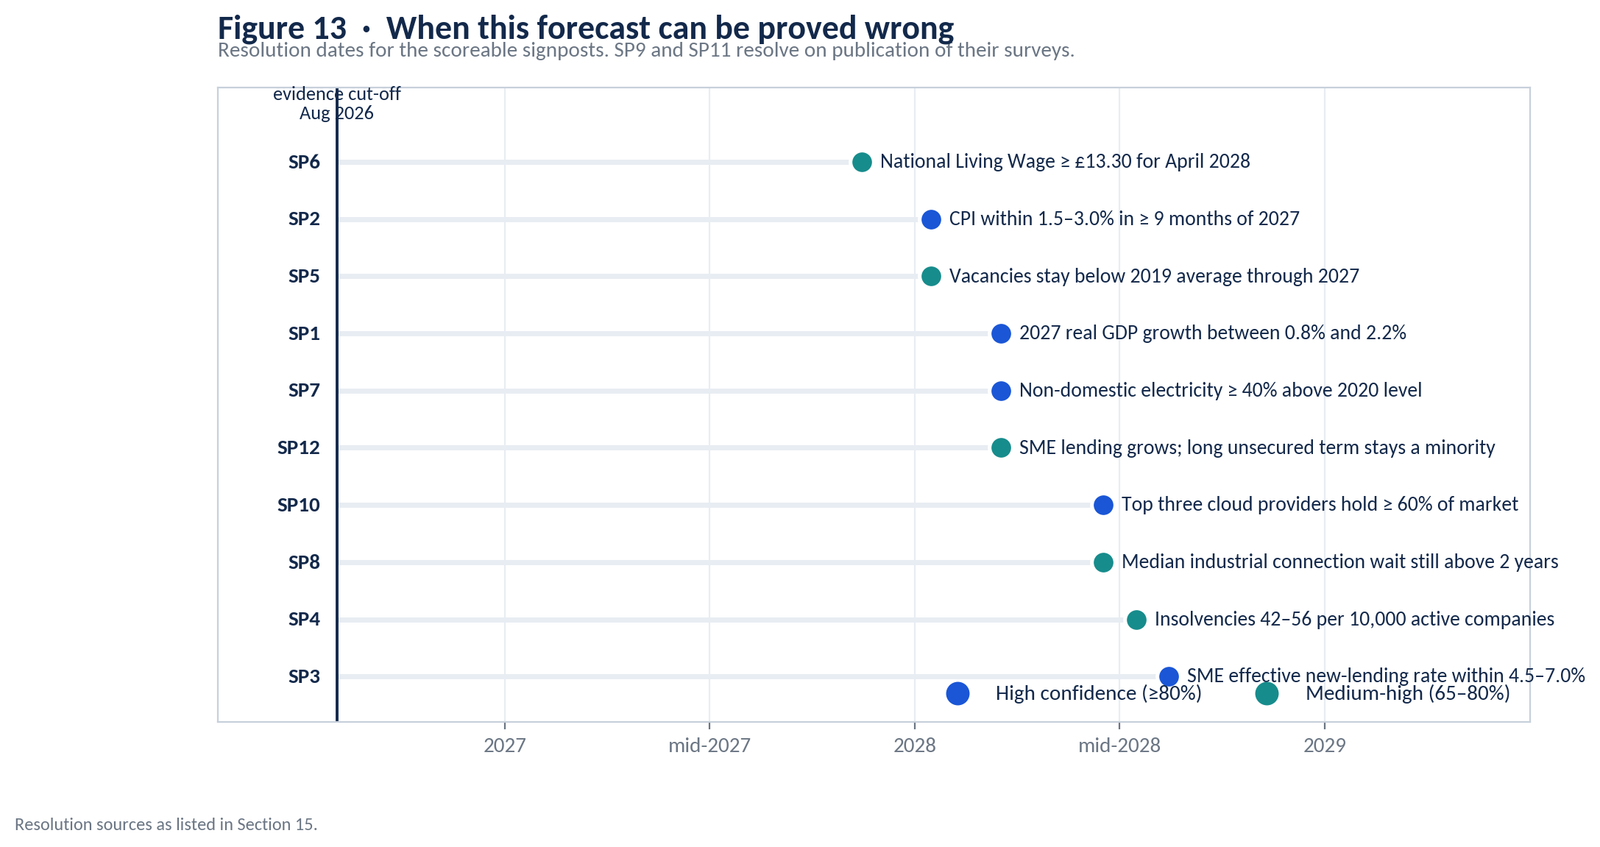
Outcomes will be scored as published, without retrospective redefinition. Where a source series is discontinued or redefined, the substitution and its effect will be documented in the evidence ledger before scoring.
16. What Would Weaken This Forecast
Beyond the scoreable signposts, the structure of the argument would weaken if UK productivity growth accelerated materially and broadly across firm sizes rather than concentrating at the frontier; if business investment rose sustainably toward peer-country levels; if long-term transformation finance became widely available to SMEs without disproportionate security or dilution; if industrial energy prices and grid connection times fell faster than expected; or if technology integration costs declined enough to lower the Minimum Capability Floor rather than raise it.
It would also weaken if platform markets became materially more interoperable, with improving data portability, falling switching costs and competitive providers emerging across cloud, payments, marketplaces and AI infrastructure. The labour forecast would need revision if employment, vacancies and hours recovered strongly across SME-heavy sectors without corresponding wage pressure, or if robotics achieved reliable low-cost physical deployment faster than current infrastructure constraints imply. The 2031 scenarios would change if trade fragmentation reversed, if semiconductor and energy capacity expanded much faster than current projects indicate, or if governments created durable open infrastructure giving SMEs advanced capability without gatekeeper dependence.
The cooperative hypothesis in Section 14 would be weakened if coordination, governance and trust costs consistently exceeded shared-capability savings in practice. That evidence will be reported if it emerges.
17. Conclusion: The Cost of Independence
The environment facing UK SMEs through 2028 will not be defined by one technology or one macroeconomic variable. It will be defined by the interaction of weak growth, elevated cost levels, selective capital, physical constraints, labour restructuring, rising capability requirements and concentrated operating infrastructure.
Section 11 makes the abstraction concrete. Standing still — not growing, simply holding the base-year margin — requires median revenue growth of roughly 7% to 10% over two years for established architectures, and considerably more for a business that is growing, because growth carries its own cost. Funding that revenue absorbs between £37,000 and £180,000 of additional working capital before a single pound of transformation investment. Margin compression of one to three points is the central case rather than the tail. And in four of the seven architectures modelled, debt-service breach is a more likely failure mode than operating loss — which means the constraint that ends a business is more often the timing of cash than the absence of profit.
The larger cost is the cost of maintaining real rather than formal independence. A business can remain legally owned by its founders while losing control over customer access, data, finance, software, payments and technical standards, and it can acquire scale while becoming unable to leave the system that supplies it. Conversely, a firm can stay smaller and more specialised while preserving strategic autonomy through direct relationships, low dependency concentration and modular capability.
By 2031 several structures will coexist: high-value independent specialists, modular niche operators, dependent platform tenants, consolidated corporate units and members of cooperative ecosystems. The count of registered SMEs will reveal less than the distribution of control beneath it. The objective is neither isolation nor centralisation but a polycentric structure — shared scale where scale creates value, distributed ownership where ownership protects autonomy, independent verification where failure matters, provider diversity where interruption is dangerous, and credible exit where dependency could become extraction.
The question facing every SME is therefore no longer only whether it can grow. It is whether it can remain economically viable, capable of development and independent enough to choose its own route — and what that will cost, in cash, margin and control, is now stated in terms that can be tested.
Appendix — Methodology, Model Architecture and Limitations
A.1 Analytical principles
The methodology is designed to keep the analytical chain visible: what is observed, what is calculated, what is inferred, what is forecast conditionally, and what remains scenario or hypothesis. The analytical unit is the operating architecture rather than the statistically average SME, because firms of similar turnover and headcount can have incompatible margins, working-capital cycles, asset requirements, labour substitutability and dependency exposure.
Five principles govern the work: economic architecture before legal category; cash flow before accounting appearance; resource complementarity; conditional forecasting rather than deterministic extrapolation; and structural scenarios rather than false probability. Official UK data are prioritised for UK conditions, while international evidence is used for global infrastructures such as cloud, semiconductors, data centres and robotics.
A.2 Core measures
| Measure | Purpose |
| Gross value added | Approximates internally created value; preferred to turnover for cross-architecture comparison. |
| Value-added productivity | GVA per full-time-equivalent employee. |
| Capital intensity and productivity | Capital employed relative to GVA, and its reciprocal. |
| Working-capital intensity | Operating working capital divided by revenue. |
| Free-cash-flow conversion | Operating cash flow less maintenance capex, divided by EBITDA. |
| Capability Burden | Required annual capability cost divided by GVA. |
| Debt-service cover | Cash available for debt service divided by interest plus scheduled principal. |
| Viable Baseline Runway | Unencumbered liquidity divided by monthly stressed cash burn. |
| Exit Capacity Ratio | Replacement and transition capacity divided by estimated exit cost. |
These measures reconcile income statement, balance sheet and cash flow. A company can report profit while becoming less liquid, more dependent and less able to replace its assets, so revenue growth is connected explicitly to receivables, inventory, payables, debt service, maintenance investment and closing cash.
A.3 Model architecture
The 2028 model has three layers. External boundary conditions set ranges for growth, inflation, wages, energy, finance and credit. Architecture-specific transmission maps those drivers into cost shares, volume, pricing and pass-through. The integrated layer then tests solvency, development capacity and strategic independence. Seven calibrated firms are run through 100,000 correlated draws using truncated normal distributions, a Gaussian copula and a fixed seed. For each draw the model computes required revenue, constrained achieved revenue, margin, additional working capital, maintenance burden and debt-service cover, and reports percentiles and breach frequencies rather than point estimates. Assumptions are separated from calculations so that any parameter can be changed and the full result regenerated.
A.4 Validation architecture and its current status
Simulation maps uncertainty through the chosen model; it does not remove model risk. Correlation is essential, because wage, energy, rate, demand and customer-failure shocks deteriorate together. The next validation steps are global sensitivity analysis to attribute output variance to inputs and interactions, and rolling-origin testing of interval coverage, directional accuracy and breach calibration. The 2031 horizon is constructed through scenario axes and cross-impact logic rather than trend extrapolation, and scenarios are assessed for plausibility, internal consistency, material difference, decision relevance and observable signposts.
A wider econometric programme is specified but not estimated, because no complete public linked panel of SME accounts, debt terms, dependency and outcomes exists. Dynamic-panel GMM would test productivity persistence and firm effects; VAR or SVAR would test transmission among energy, inflation, rates and activity under explicit identification assumptions; logit or hazard models would calibrate distress probability; principal component analysis would reduce correlated drivers without claiming causality. No coefficient from those specifications is presented anywhere in this report, and Granger-type tests are interpreted as predictive precedence rather than economic causation. Econometric sophistication is useful only where data, identification and decision purpose justify it.
A.5 Model governance and limitations
Model governance requires recorded source series and vintages, transformation rules, assumptions and rationale, formulas and version history, sensitivity ranges, known limitations and reviewer approval. Hardcoded assumptions stay separate from calculations, scenario changes do not overwrite the baseline, and material outputs reconcile to accounting identities.
Public UK data provide no complete linked panel of SME accounts, debt terms, customer concentration, platform dependence and outcomes.
Architecture calibrations are illustrative test cases rather than population averages, and their breach probabilities measure the consequences of the disclosed assumptions, not the truth of those assumptions.
Pass-through is the most consequential unobserved input and is therefore carried as a disclosed range.
Tax, owner distributions, growth capex and exceptional shocks are excluded from the two-year model.
Insolvency statistics capture formal events rather than the full extent of economic attrition.
Platform dependency is not measured directly in any single official dataset and requires participant-level operational evidence.
The £3–5 billion aggregate-GVA range for a self-sufficient shared-capability consortium is an order-of-magnitude calibration requiring a dedicated functional-cost model.
A.6 Editorial note
This report uses official and institutional evidence available to the stated cut-off. The 2028 results are conditional forecasts and disclosed model outputs, not deterministic predictions. The 2031 sections are interwoven structural scenarios and carry no assigned probabilities. For web publication, source identifiers in the text should link to a concise reference list or expandable evidence notes; the full working ledger may remain a technical supplement containing complete citations, claim mapping, calculation notes and limitations. A forecast is credible when its assumptions are visible, its financial mechanics reconcile, its uncertainty is measured, its causal claims are bounded, its strategic conclusions hold under more than one plausible future — and when it states plainly how it can be shown to be wrong.
Sources and technical evidence
The source markers used throughout the article link to the corresponding entry below. Full claim mapping, calculation notes and model limitations are maintained in the technical evidence ledger.
Open source list (52 cited sources)
[S01] Cabinet Office, Supplementary information: Small and medium-sized enterprises definition (GOV.UK, 2026), Source link (accessed 2 August 2026).
[S02] Companies House, Life of a company: annual requirements - accounts (GOV.UK, 2025), Source link (accessed 2 August 2026).
[S03] Department for Business and Trade, Business population estimates for the UK and regions 2025 (2025), Source link (accessed 2 August 2026).
[S04] International Energy Agency, Energy and AI (2025), Source link (accessed 2 August 2026).
[S05] Department for Energy Security and Net Zero, Government to tackle speculative demand grid connection requests (2026), Source link (accessed 2 August 2026).
[S06] National Energy System Operator, Connections reform results (2025), Source link (accessed 2 August 2026).
[S07] Office for National Statistics, The impact of higher energy costs on UK businesses, 2021 to 2024 (2025), Source link (accessed 2 August 2026).
[S08] Department for Energy Security and Net Zero, Quarterly Energy Prices, June 2026 (2026), Source link (accessed 2 August 2026).
[S09] Bank of England, Money and Credit - April 2026 (2026), Source link (accessed 2 August 2026).
[S10] Bank of England, Credit Conditions Survey - 2026 Q2 (2026), Source link (accessed 2 August 2026).
[S11] British Business Bank, Small Business Finance Markets Report 2026 (2026), Source link (accessed 2 August 2026).
[S12] Office for National Statistics, Labour market overview, UK: July 2026 (2026), Source link (accessed 2 August 2026).
[S13] Office for National Statistics, Vacancies and jobs in the UK: July 2026 (2026), Source link (accessed 2 August 2026).
[S14] Office for National Statistics, Employment in the UK: July 2026 (2026), Source link (accessed 2 August 2026).
[S15] Department for Science, Innovation and Technology, UK Business Data Survey 2026 (2026), Source link (accessed 2 August 2026).
[S16] Office for Budget Responsibility, Where can I find your latest forecasts? (2026), Source link (accessed 2 August 2026).
[S17] Office for National Statistics, UK productivity: introduction (2026), Source link (accessed 2 August 2026).
[S18] Office for National Statistics, Business investment in the UK: January to March 2026 revised results (2026), Source link (accessed 2 August 2026).
[S19] Competition and Markets Authority, The State of UK Competition Report 2024 (2024), Source link (accessed 2 August 2026).
[S20] UN Trade and Development, Technology and Innovation Report 2025 (2025), Source link (accessed 2 August 2026).
[S21] Competition and Markets Authority, Cloud services market investigation (2025), Source link (accessed 2 August 2026).
[S22] OECD, The Digital Transformation of SMEs (2021), Source link (accessed 2 August 2026).
[S23] Department for Business and Trade, Business Regulation: Business Perceptions Survey 2024 - executive summary (2025), Source link (accessed 2 August 2026).
[S24] Bank of England, Financial Stability Report - July 2026 (2026), Source link (accessed 2 August 2026).
[S25] Bank of England, Agents' Summary of Business Conditions - July 2026 (2026), Source link (accessed 2 August 2026).
[S26] Department for Business and Trade, The National Minimum Wage in 2026 (2025), Source link (accessed 2 August 2026).
[S27] Office for National Statistics, Economic inactivity rate: people aged 50 to 64 (2026), Source link (accessed 2 August 2026).
[S28] Stanford Institute for Human-Centered AI, The 2026 AI Index Report (2026), Source link (accessed 2 August 2026).
[S29] International Federation of Robotics, World Robotics 2025 (2025), Source link (accessed 2 August 2026).
[S30] State Council of the People's Republic of China, China establishes over 30,000 smart factories (MIIT, 2025), Source link (accessed 2 August 2026).
[S31] State Council of the People's Republic of China, China unveils plan to deepen integration of industrial internet and AI (MIIT, 2026), Source link (accessed 2 August 2026).
[S32] Tesla, Master Plan Part IV (2025), Source link (accessed 2 August 2026).
[S33] OpenAI, Built to benefit everyone: our plan (2026), Source link (accessed 2 August 2026).
[S34] Anthropic, Anthropic's recommendations to OSTP for the U.S. AI Action Plan (2025), Source link (accessed 2 August 2026).
[S35] The Insolvency Service, Company insolvencies: June 2026 (2026), Source link (accessed 2 August 2026).
[S36] Office for National Statistics, CPI Index 00: All Items 2015=100 - D7BT (2026), Source link (accessed 2 August 2026).
[S37] Office for National Statistics, Gross Domestic Product: chained volume measures - ABMI (2026), Source link (accessed 2 August 2026).
[S38] Office for National Statistics, Real household disposable income per head - CRXW (2026), Source link (accessed 2 August 2026).
[S39] Office for Budget Responsibility, Brexit analysis (2026), Source link (accessed 2 August 2026).
[S40] House of Lords Economic Affairs Committee, Quantitative easing: a dangerous addiction? (2021), Source link (accessed 2 August 2026).
[S41] Bank of England, The financial market impact of quantitative easing (2010), Source link (accessed 2 August 2026).
[S42] World Trade Organization, Global Trade Outlook and Statistics - March 2026 (2026), Source link (accessed 2 August 2026).
[S43] International Monetary Fund, United Kingdom: 2025 Article IV Consultation (2025), Source link (accessed 2 August 2026).
[S47] Department for Energy Security and Net Zero, International non-domestic energy prices (2026), Source link (accessed 2 August 2026).
[S48] Department for Business and Trade, The UK Steel Strategy (2025), Source link (accessed 2 August 2026).
[S49] Stanford Institute for Human-Centered AI, Economy chapter - 2026 AI Index Report (2026), Source link (accessed 2 August 2026).
[S50] The White House, Winning the AI Race: America's AI Action Plan (2025), Source link (accessed 2 August 2026).
[S51] State Council of the People's Republic of China, Xi urges promoting healthy and orderly development of AI (2025), Source link (accessed 2 August 2026).
[S52] UN Trade and Development, Highly concentrated digital markets put consumers at risk (2025), Source link (accessed 2 August 2026).
[S54] Office for National Statistics, Growth accounting: multifactor productivity estimates, UK (2025), Source link (accessed 2 August 2026).
[S55] Companies House, Companies House data products (n.d.), Source link (accessed 2 August 2026).
[S56] Office for National Statistics, Annual Business Survey quality and methodology information (n.d.), Source link (accessed 2 August 2026).