
One of the most dangerous moments in business is when the sales report looks healthy but the bank account tells a different story.
Revenue is rising. Orders are arriving. Production is busy. Yet liquidity is tightening, supplier conversations are becoming harder, and the company is using more of its facility simply to carry normal activity.
The usual explanation is late payment — and it is a real problem. The UK government estimates that late payments cost the economy £11 billion a year and are associated with 38 business closures a day.1 But that explanation is rarely complete. Chasing debtors harder does not repair a sales price that never included the cost of customer credit. It does not remove rework from the delivery process. It does not correct an order that absorbed materials, labour and working capital long before the customer paid.
The deeper problem is structural. Sales, price, cost, risk, process and payment timing have been treated as separate management questions — and cash is the place where those disconnected decisions finally collide.

The task: move cash control in front of the invoice
Traditional cash control starts too late. An invoice is issued, a payment term begins, and finance watches the due date. When cash does not arrive, the business escalates collection, delays spending or negotiates with suppliers. Those actions may be necessary — but they respond to a structure that already exists. By the time an invoice is overdue, the company has accepted the customer, set the price, granted the terms, bought the materials, committed the labour and accepted the risk. Most of the cash outcome was decided well before the payment became overdue.
The stronger starting point is the commercial decision itself. We call this discipline Cash-Cycle Design: structuring the business so that every sale has the best possible chance of becoming healthy cash. It rests on six connected moves.
01 Price for time, risk and money — not just cost plus margin
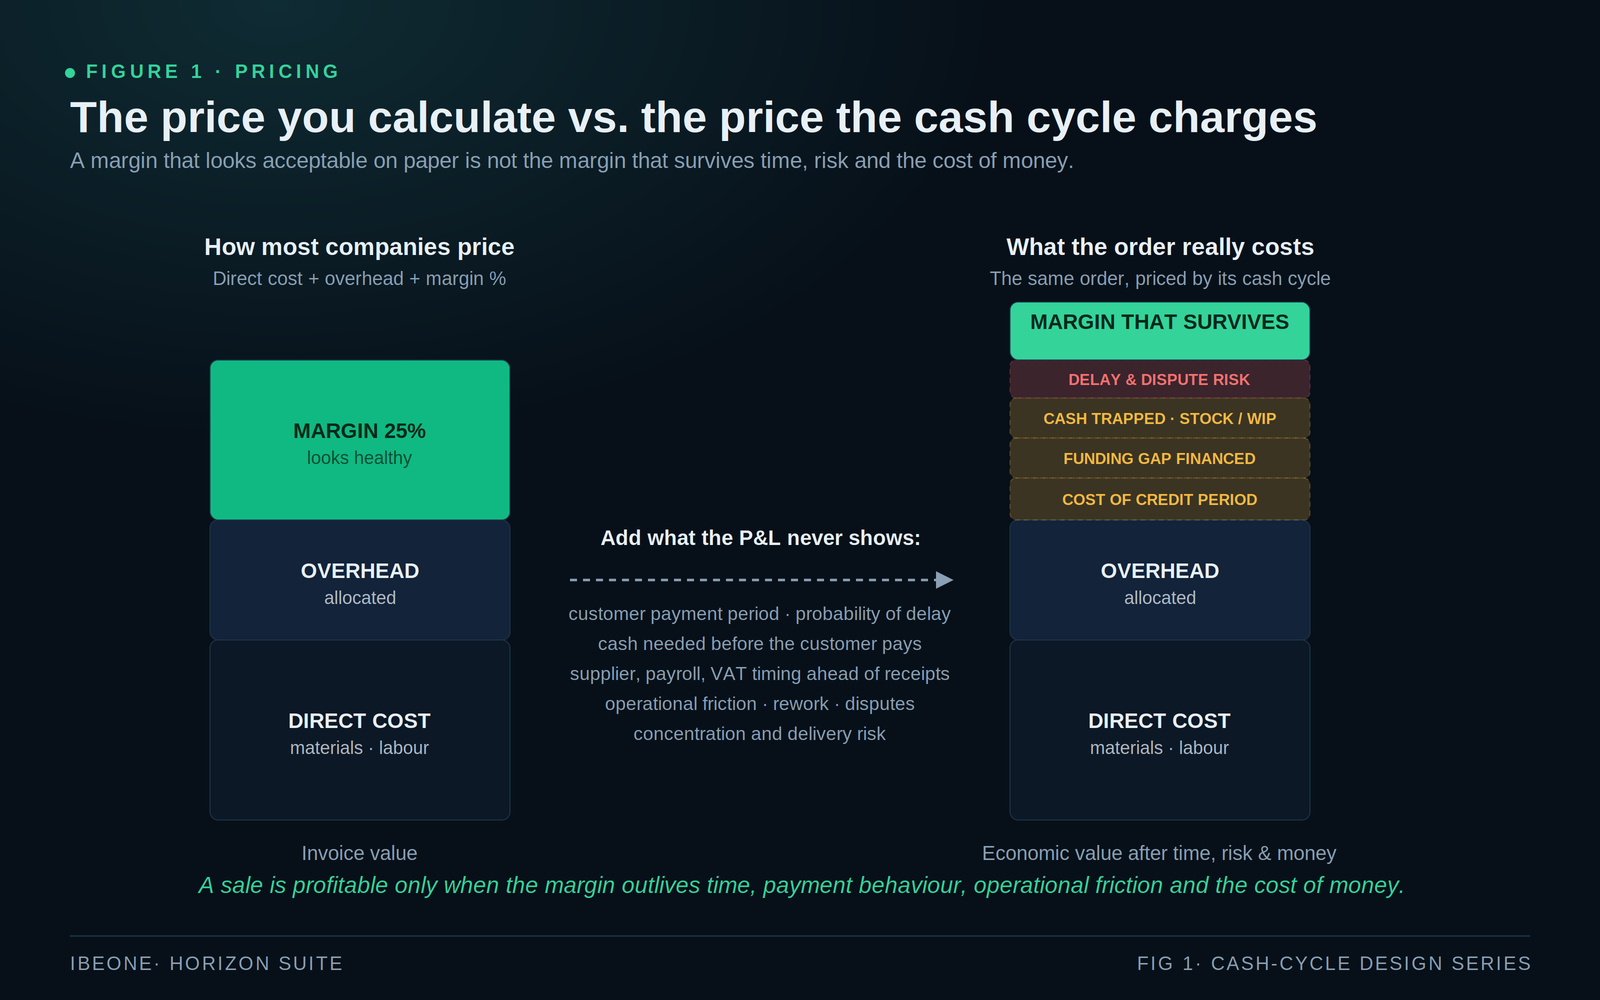
Most companies price around direct cost, an overhead allocation and a desired margin. That produces a valid accounting calculation. It does not always produce a durable price — one that can carry the real behaviour of the order: payment delay and its probability, the funding gap between paying suppliers and being paid, cash locked in stock and work-in-progress, service intensity, dispute risk, financing cost, and the chance that something does not go exactly as planned.

This is not a universal formula. A contractor, a consultancy, a dental practice and a manufacturer do not share the same labour rhythm, stock exposure or payment behaviour. The logic is transferable, but the thresholds are not universal. They must be calibrated to the sector, operating rhythm, customer profile, cost structure and risk appetite of the company.

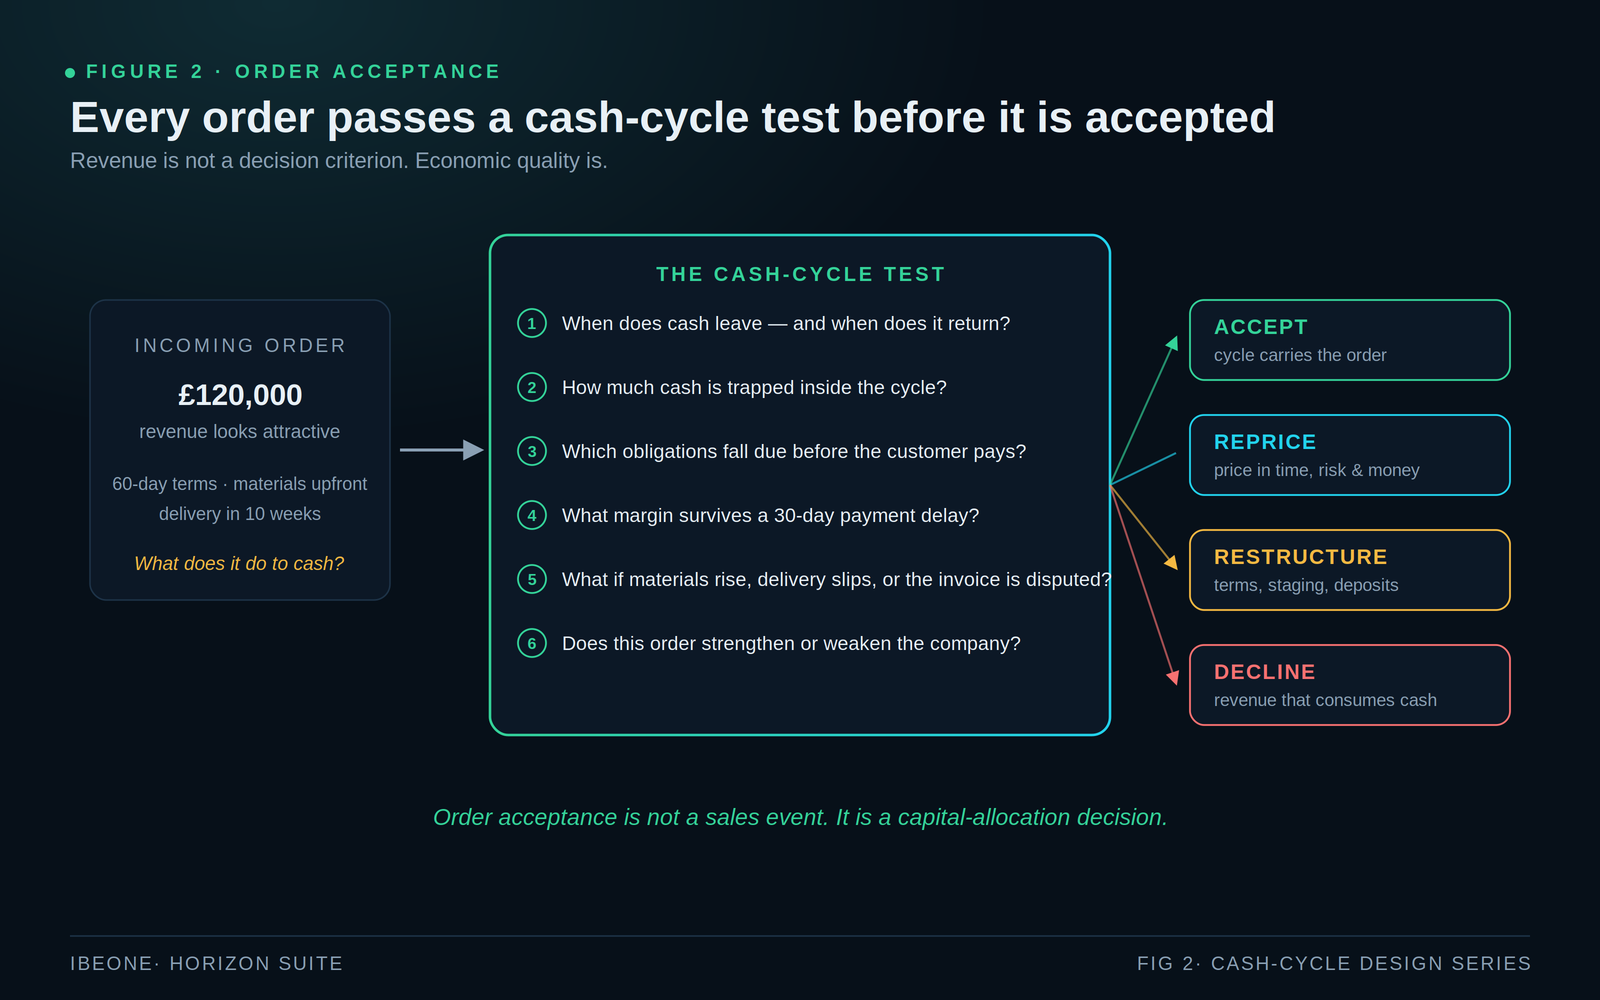
02 Test the economic quality of every order before accepting it
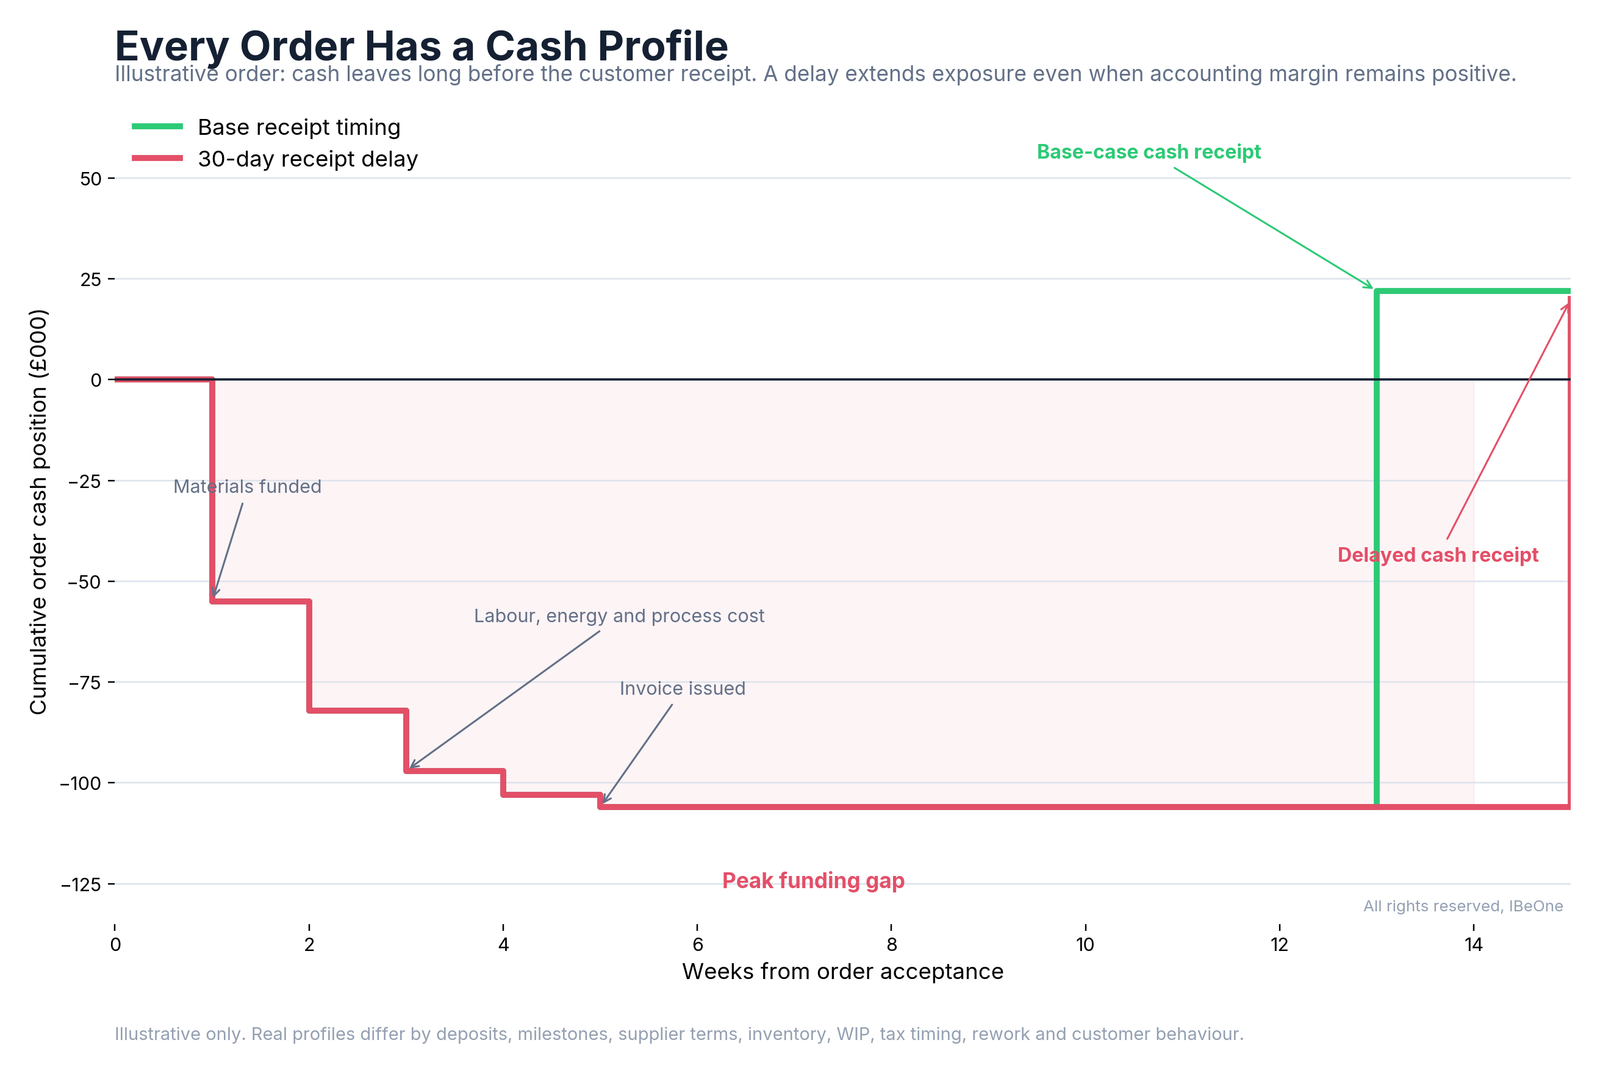
Every order has an economic fingerprint. Two orders with identical revenue and identical reported gross margin can produce completely different outcomes. One takes a deposit, uses free capacity, invoices immediately and collects in 14 days. The other requires materials upfront, overtime, staged approvals and 60-day terms. Their accounting margin looks the same. Their cash quality is not.
An illustrative order makes the gap concrete: quoted revenue of £150,000 with a headline margin of £30,000 can commit up to £106,000 of cash at its peak — and after expected process leakage, credit and time cost, and a realistic risk and service allowance, the margin that actually survives is closer to £20,700, before any further delay or shock.6 The point is not to reject orders that use working capital; many excellent orders do. The point is that the exposure should be visible, deliberately priced and compared with the opportunity it creates.
| Measure | Illustrative position | Management meaning |
|---|---|---|
| Quoted revenue | £150,000 | Commercially attractive at first sight |
| Headline margin | £30,000 | Before timing, process leakage and risk |
| Peak cash committed | £106,000 | Funding exposure before the receipt arrives |
| Durable economic margin | Approx. £20,700 | What may remain after expected leakage, credit/time cost and service/risk allowance |

03 Treat customer credit as a product with a price
When a customer receives 60-day terms, the supplier is financing part of that customer’s operating cycle. The arrangement may be commercially necessary, but it is not free. A first approximation of the direct cost is simple:

The financing charge is only the visible layer. The wider price includes reduced headroom, supplier pressure, lost opportunity and concentration risk — several individually manageable delays arriving together and becoming a system problem. This is why payment terms are not boilerplate at the bottom of a quotation. Deposits, milestones, credit limits, staged delivery and evidence requirements all change the cash profile. They are part of the commercial price.

04 Watch the scissors — especially while growing
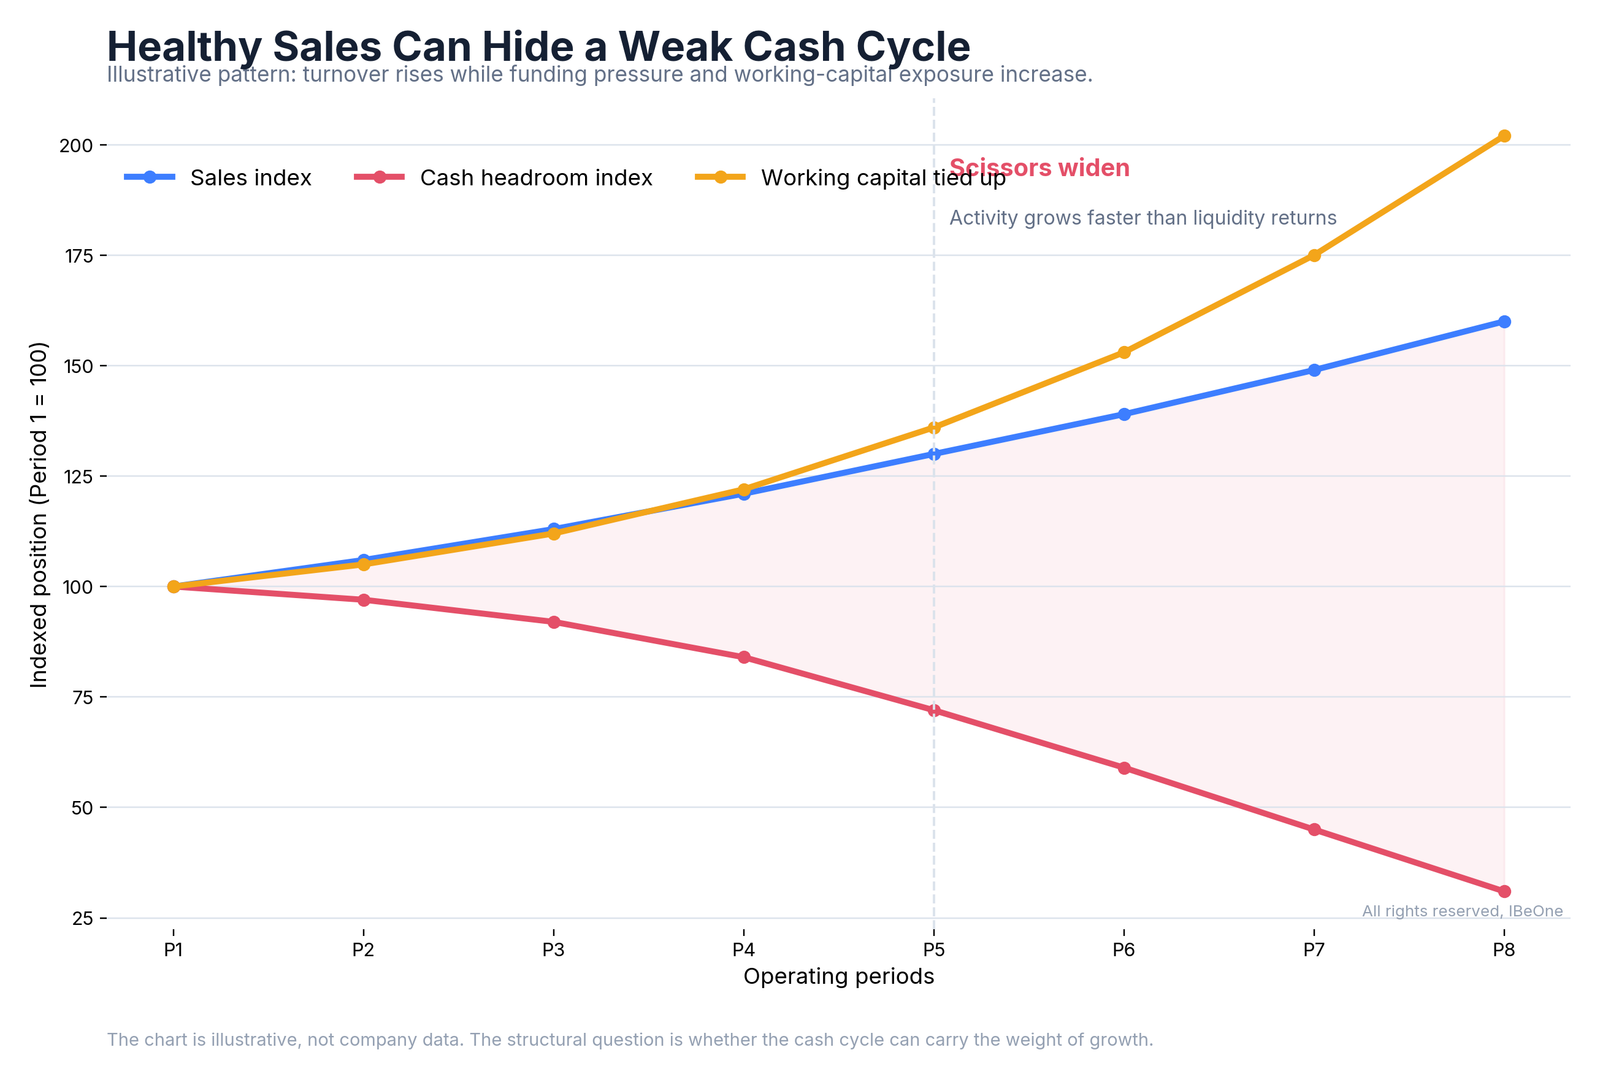
The cash-cycle scissors describe a familiar but poorly integrated pattern. Sales increase, so materials are bought earlier. Payroll and tax stay fixed in time. Suppliers tighten their terms; customers extend theirs. Inventory and work-in-progress rise to support the new volume. Each movement looks reasonable in isolation. Together, cash commitments accelerate while collections decelerate — and a liquidity gap opens between the blades.
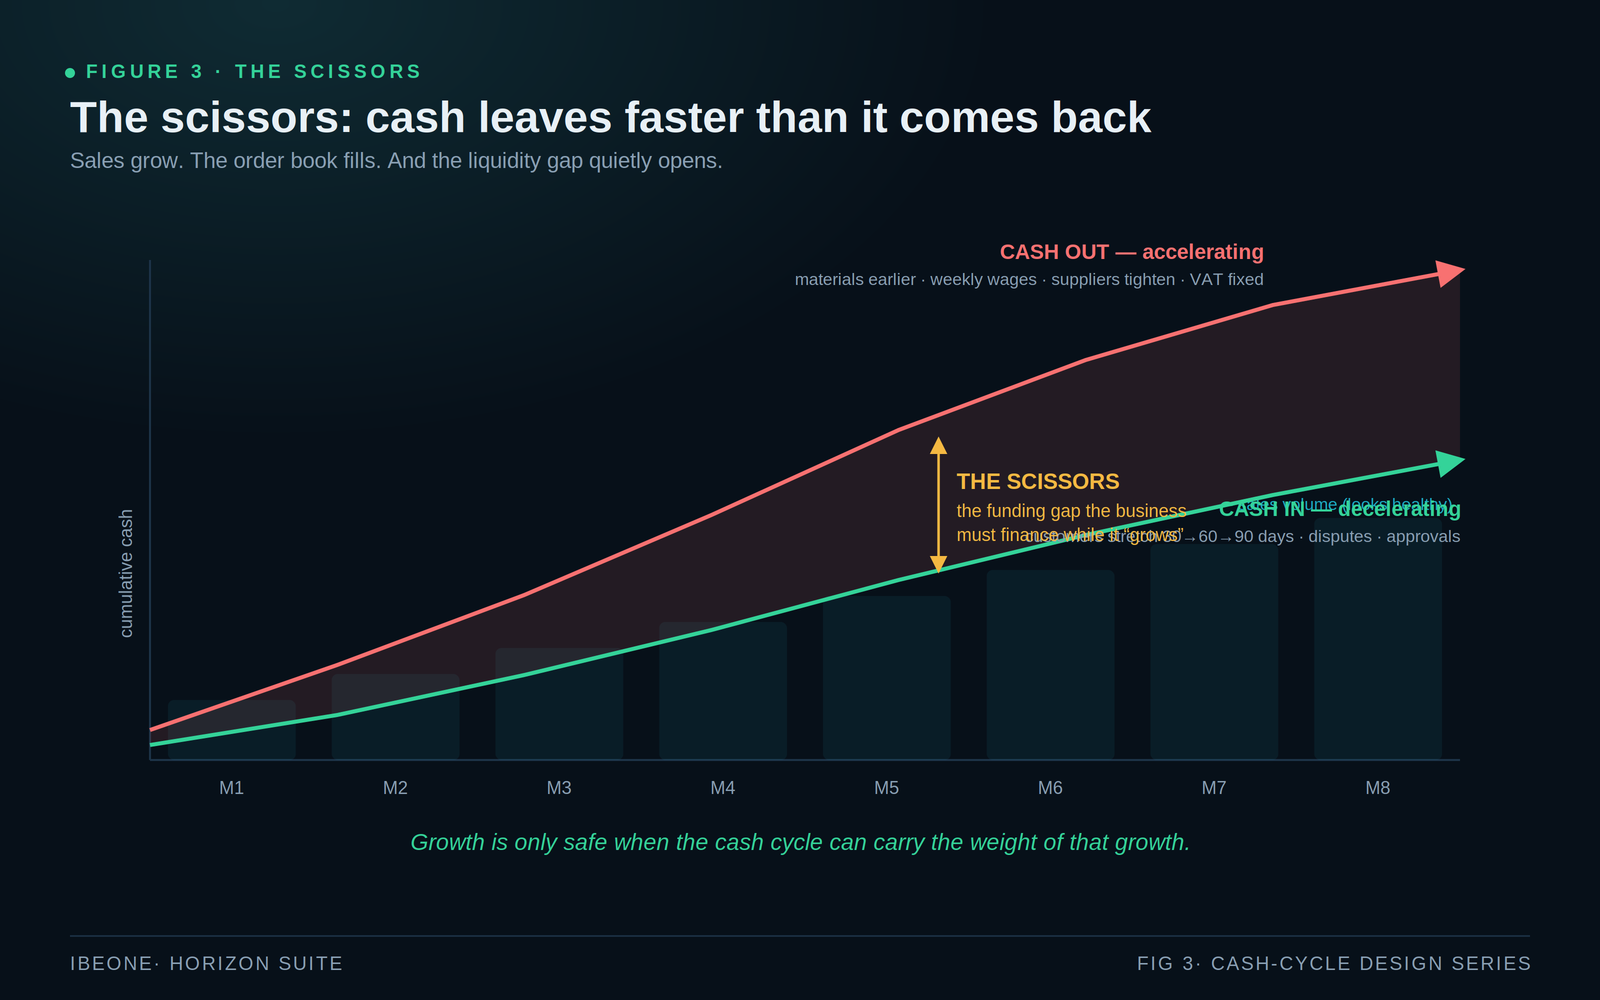
The standard cash conversion cycle — inventory days plus receivable days minus payable days — remains useful. Research on small firms links more efficient cash conversion with stronger liquidity, lower financing requirements and higher returns,2 and UK SME evidence indicates that the relationship between working capital and profitability is not simply “the less, the better” — there can be an economically optimal level.3 But the average ratio is only the beginning. Deposits, WIP, milestone billing, approval delay and customer concentration often determine the real cycle more strongly than any single measure.
This is also why growth — usually treated as the cure for cash pressure — is sometimes its cause. Higher turnover can mean more debtors, more stock, more WIP, larger supplier commitments and heavier VAT timing, all funded before a single additional pound is collected. A business can become larger, busier and less resilient at the same time. The dangerous pattern is not growth itself; it is growth whose cash demand is invisible until the company has already committed to it.

05 Map the cycle — and price the waste inside it
You cannot control cash from the bank account alone. The bank account is where the outcome becomes visible; the cause sits across the operating cycle: lead → quote → order → purchase → work → delivery → invoice → collection → margin → cash. The job of finance is to identify where, along that route, cash is trapped or destroyed — in stock, work-in-progress, rework, waiting, unclear handovers, disputes, slow approvals, and supplier, payroll and tax timing that all land before collection does.
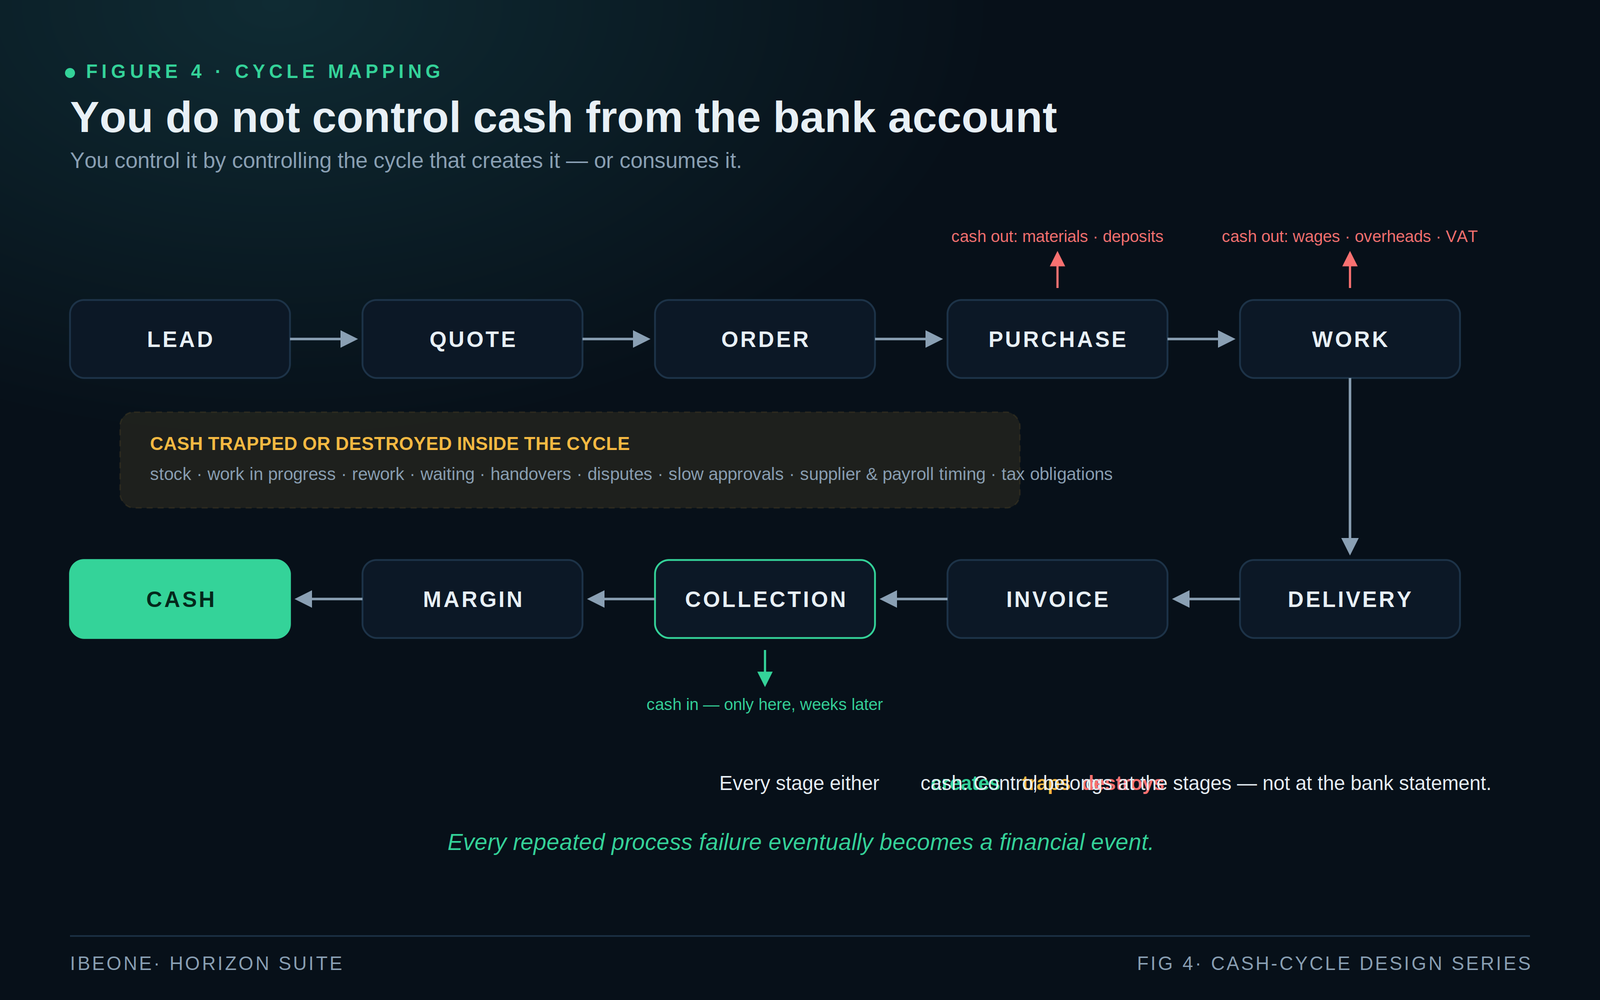
Seen this way, waste stops being an “operations topic”. Financially, waste is trapped cash, lost margin and absorbed management attention. The cost-of-quality framework makes the connection explicit by separating prevention, appraisal, internal-failure and external-failure costs,4 and the strongest financial controls are often built into the process before a mistake occurs, close in spirit to Poka-Yoke: design the route so avoidable failure is prevented or made visible where correction is still cheap. Not all prevention cost is waste; the objective is not zero cost but a lower total cost of failure.

06 Manage cash through upstream decision variables — with checkpoints
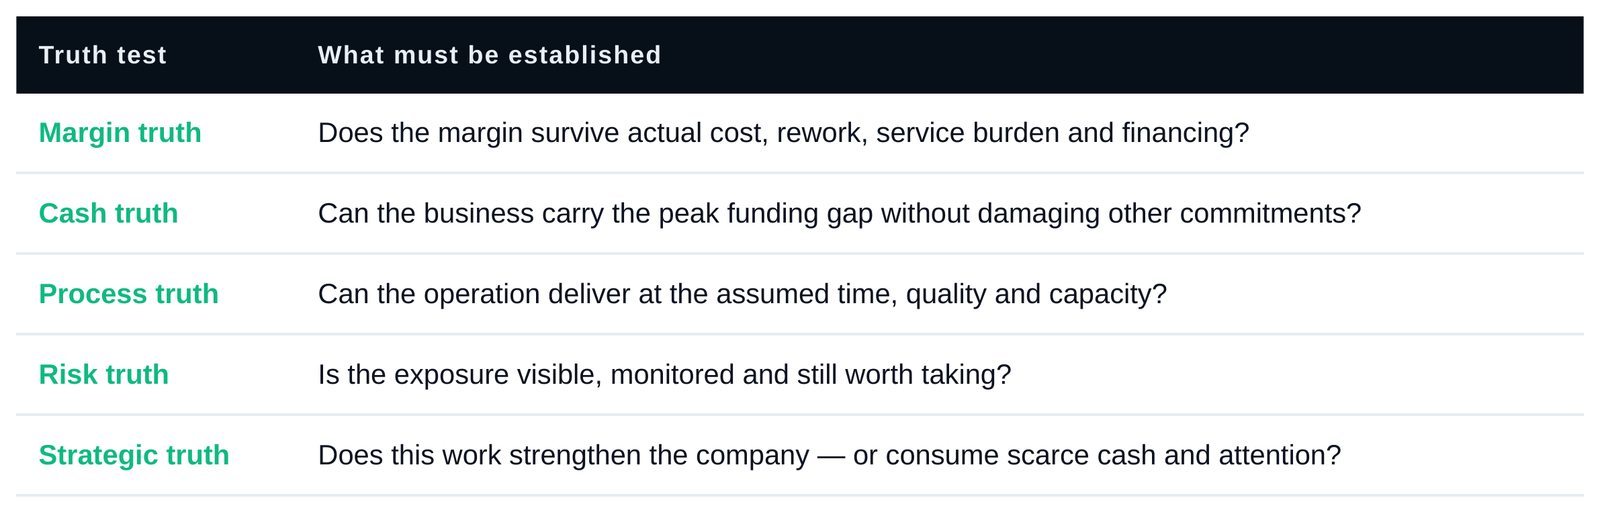
Put the pieces together and a structural truth emerges. Liquidity, financing cost, risk exposure and growth capacity are outcomes of the current cycle. The upstream decision variables sit where management can act: pricing, commercial terms, order-selection rules, supplier and payroll timing, process quality and growth pace. Between them sits a transmission layer — receivable days, payable days, stock and WIP, margin erosion and the funding gap — where the effects compound.
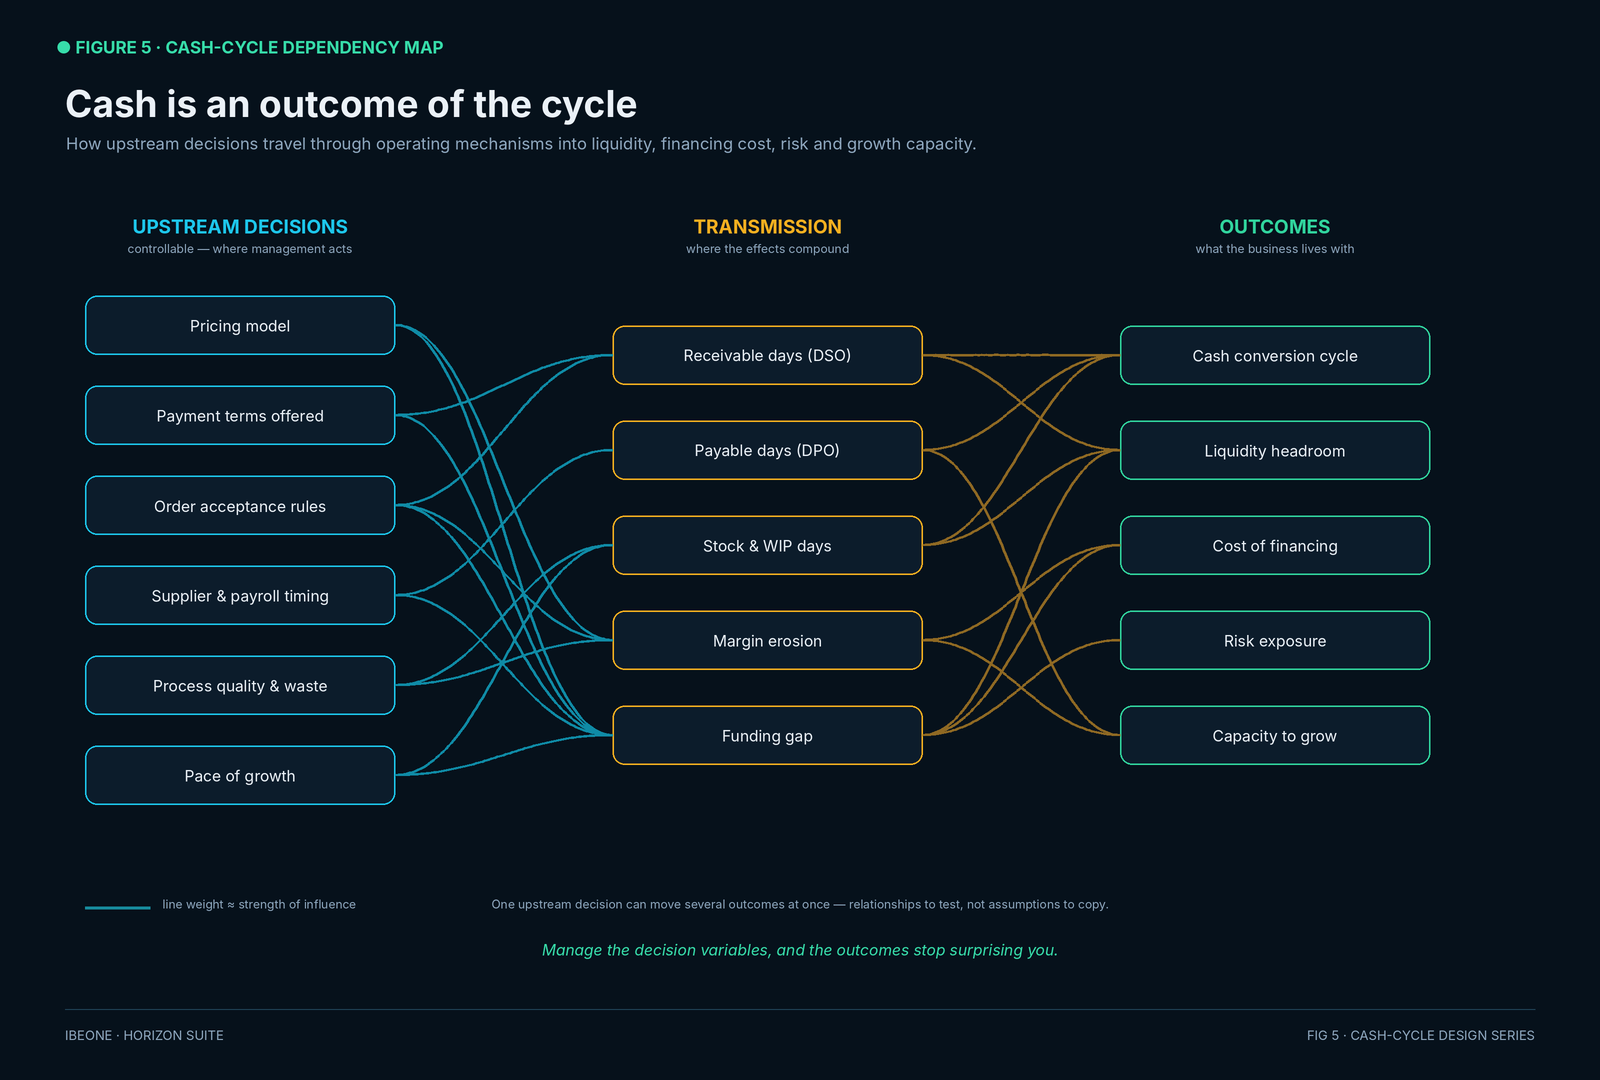
Correlation alone is not proof of cause. The real test is whether the operating event, financial movement and repeated relationship can be traced through the cycle. A proper management system tests which event changed, which process carried the change, which financial measure responded, and whether the relationship repeats under comparable conditions.
That logic becomes practical through checkpoints defined before pressure arrives — at quote, purchase, work, delivery and collection — each with a visible signal and prepared response, following the integrated risk logic of ISO 31000: identify, analyse, evaluate, treat and monitor.5 Thresholds must be calibrated to the company and sector, not copied.

The result: a wider, more profitable decision set
The purpose of this system is not to make management defensive. It is to create better choices than “sell or do not sell”. Once durable margin and cash quality are visible together, management can distinguish work that deserves capital from work that only looks busy.
A business with strong cash-cycle design does not merely avoid crisis. It negotiates from a stronger position, uses capital deliberately and protects the activities that create real value. Sales prove the market is buying. They do not prove the business model is economically sound — and the difference between the two is exactly where control is won or lost.
- UK Department for Business and Trade, Commercial Payments Bill: overview, 19 May 2026.
- Jay J. Ebben and Alec C. Johnson, Cash Conversion Cycle Management in Small Firms: Relationships with Liquidity, Invested Capital, and Firm Performance, Journal of Small Business & Entrepreneurship.
- Godfred Afrifa and Krishnan Padachi, Working capital level influence on SME profitability, Journal of Small Business and Enterprise Development.
- American Society for Quality, Cost of Quality.
- International Organization for Standardization, ISO 31000:2018 — Risk management guidelines.
- All numerical examples and diagrams are illustrative. They are not company data, financial advice or universal decision thresholds. Company, sector, jurisdiction and operating-model calibration is essential.