
The ledger is useful, but it can also be a graveyard of intentions. If you read your 13-week cash flow as a standard balance sheet, you are merely reviewing the past – you are often reading an autopsy report.
In my nearly decade as a CFO, I have encountered the 'Green Week' paradox more than once. It is the defining friction of the boardroom: the subtle, systemic pressure to maintain an aura of stability even when the underlying mechanics of the business are failing. I have stood at the whiteboard while we collectively deferred to an overly optimistic model—essentially choosing to focus on the orderly state of the ledger rather than the encroaching liquidity crisis. We would arrive at Week 7, see that reassuring, green-coded balance, and exhale. We had balanced the table, satisfied the reporting requirement, and fulfilled the boardroom’s desire for calm. We had checked the box, but we had failed to read the reality.
This is completely wrong. This is not the goal.
That £42,000 is not a liquidity cushion; it is a failure of imagination. It is a static ghost that ignores the brutal, uneven rhythm of the real world – the suffocating rhythm of wages, the unnegotiable fist of the HMRC deadline and the ever-changing friction of debtor delays, disputes and stretched payment behaviour.
The 13-week cash flow is not a reporting exercise. It is a tool used as a war room.
When you think of it as accounting, you are a historian chronicling the demise. When you think of it as a management narrative, you become an architect of survival. The value is not in the final balance; it is in the tension between the lines. It is the ability to see the collision before the glass breaks.
From an accounting perspective, the number is called “solvency”. The CFO looks at the pressure and calls it the “decision point”.
Stop making spreadsheets. Start mapping the terrain. If your forecast doesn’t scream trouble three weeks before you actually find yourself in it, it is not a forecast – it is fiction. Your job is not to report the weather, but to weather the storm.
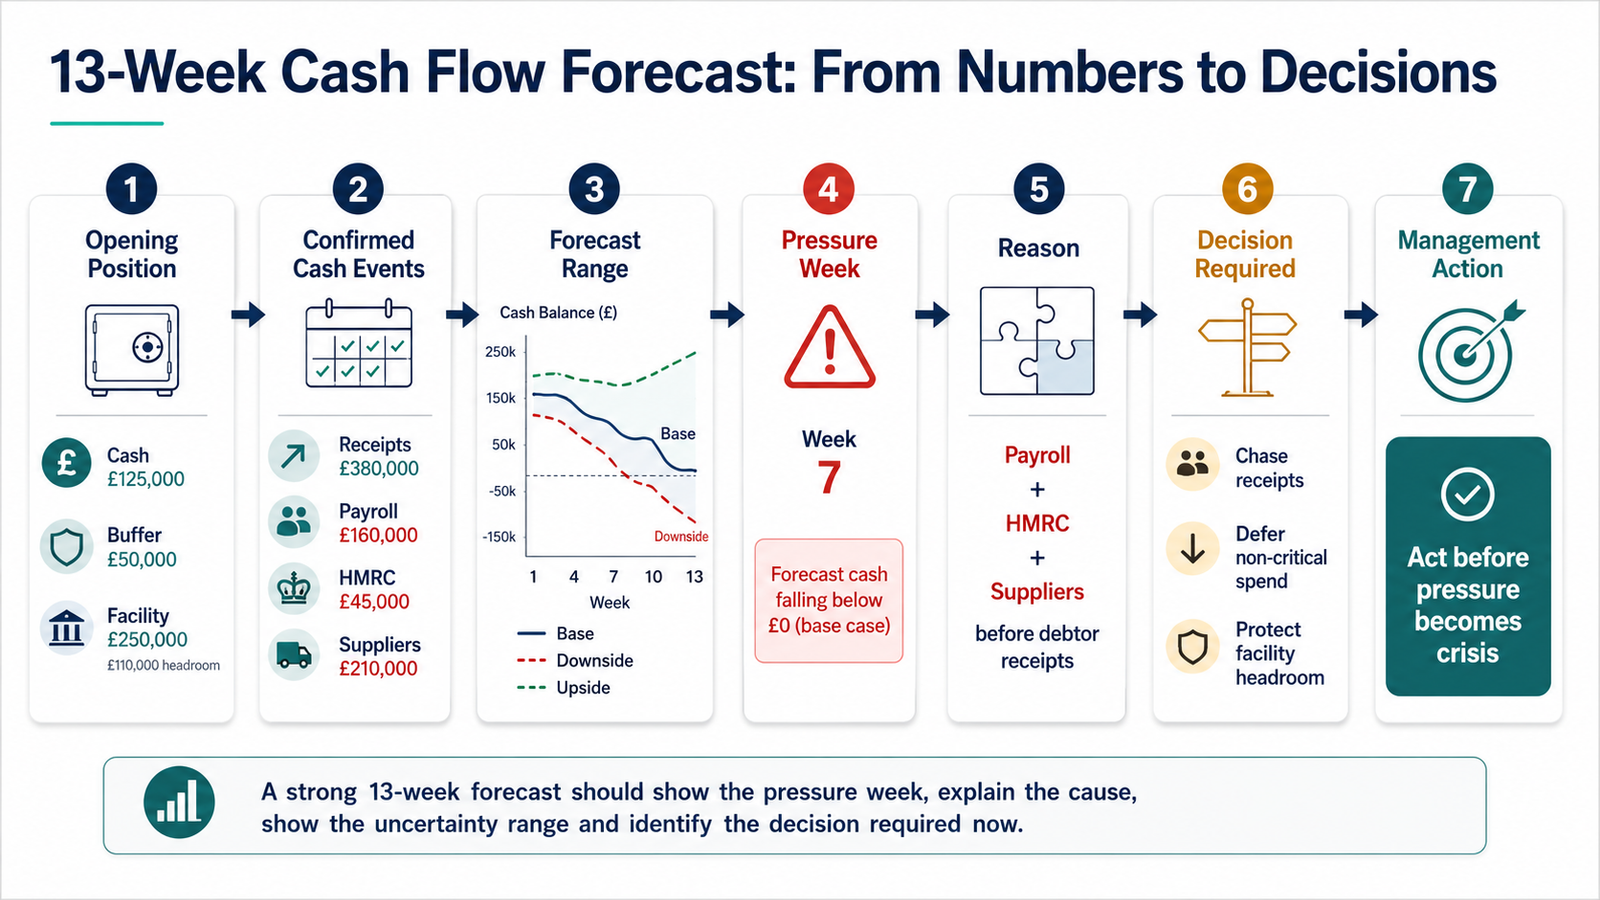
1. Why 13 Weeks Matters
Thirteen weeks is not magic.
It is practical.
It is long enough to see payroll cycles, HMRC timing, rent, supplier runs, debtor collections, stock purchases, loan repayments and operational commitments. At the same time, it is short enough to stay close to the reality of the business.
A 12-month budget can support planning.
A five-year model can support strategy.
But a 13-week cash flow forecast tells management whether the business can breathe.
It answers questions that matter immediately:
| Forecast question | Management meaning |
|---|---|
| What cash do we have now? | Starting point |
| What cash is genuinely expected to arrive? | Collection reality |
| What cash must leave the business? | Payroll, HMRC, suppliers, loans |
| Which week creates pressure? | Timing collision |
| Which assumptions could fail? | Risk exposure |
| What decision is required now? | Management action |
A 13-week forecast should not sit quietly inside finance.
It should be part of the weekly management rhythm.
2. The Green Week Illusion
The “green week” is one of the most dangerous things in cash forecasting.
Not because green is wrong.
Green is useful. It tells management that the forecasted closing cash is above zero, above a buffer, or above an agreed threshold.
The danger starts when green becomes permission to stop thinking.
A positive number in week 7 can hide several different realities:
| Green number shown | What may be hidden underneath |
|---|---|
| £42,000 closing cash | Cash is above zero, but below the minimum buffer |
| Debtor receipts included | Customers have not confirmed payment timing |
| Supplier payments assumed | Suppliers may demand earlier payment |
| Payroll included | But PAYE/NIC or pension timing may be missing |
| HMRC included | But the statutory date may collide with payroll or supplier pressure |
| Sales receipts forecast | But delivery, invoicing or customer approval may delay cash |
| Facility ignored | Headroom may be lower than management thinks |
This is why the forecast must not stop at the closing balance.
A serious 13-week cash flow review always asks:
What has to happen for the green number to remain true?
That question changes everything.
It forces management to test debtor behaviour, supplier pressure, HMRC timing, payroll rhythm, operational delivery and facility headroom. It turns the forecast from a table into a management control system.
A weak forecast says:
“Week 7 closing cash is £42,000.”
A strong forecast says:
“Week 7 is the pressure point. Payroll, HMRC and key supplier payments arrive before two major debtor receipts. If one customer pays late, the business falls below the minimum cash buffer. The decision this week is to escalate collections, defer non-critical spend and confirm facility headroom.”
That is the difference between a finance table and a management story.
3. The Forecast Starts Before Week 1
Most weak forecasts fail before the first weekly column begins.
They start with opening cash, but not with an opening position.
There is a difference.
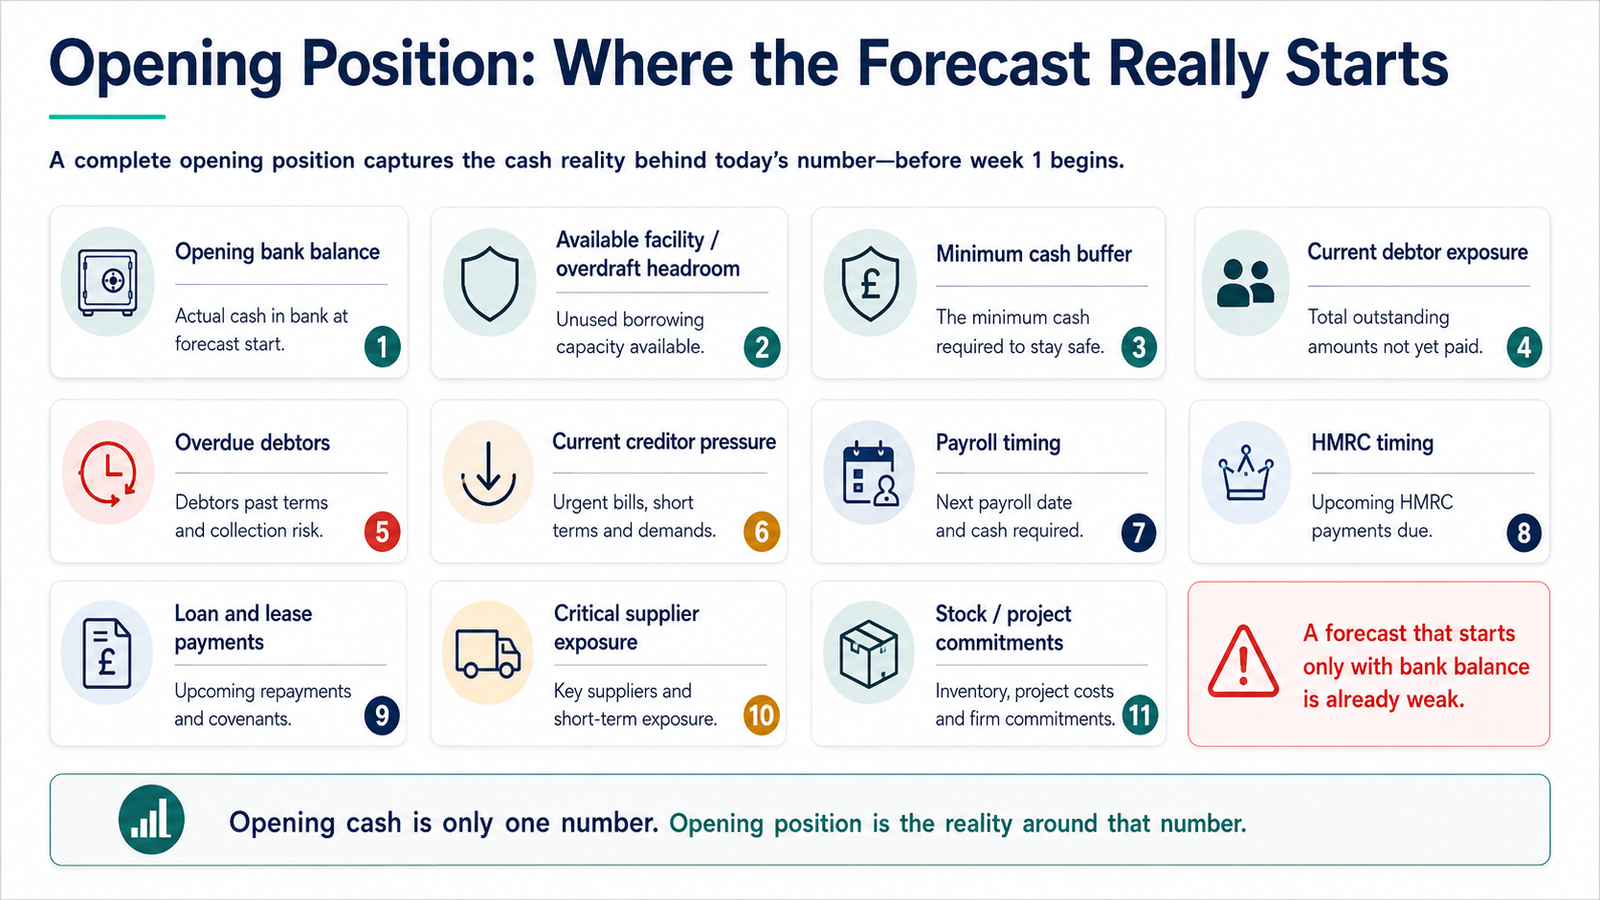
Opening cash is one number.
Opening position is the reality around that number.
A proper 13-week forecast should start with:
| Opening-position item | Why it matters |
|---|---|
| Opening bank balance | The actual cash starting point |
| Available overdraft or facility | The real liquidity headroom |
| Minimum cash buffer | The safety line management wants to protect |
| Current debtor exposure | Cash expected but not yet received |
| Overdue debtors | Risk already sitting inside the forecast |
| Current creditor pressure | Payments already due or overdue |
| Payroll timing | Fixed human commitment |
| HMRC timing | VAT, CIS, PAYE/NIC, corporation tax or other statutory pressure |
| Loan and lease payments | Contractual cash obligations |
| Critical supplier exposure | Payments that can stop operations if not managed |
| Stock or project commitments | Cash tied to delivery before receipts arrive |
A forecast that starts only with bank balance is already weak.
Weak opening statement:
“We start with £500,000 in cash.”
Useful opening statement:
“We start with £500,000 in cash, but £250,000 is our minimum buffer, £180,000 payroll is due in week 2, £140,000 HMRC is due in week 4, £320,000 debtors are expected across weeks 3–5, and £210,000 of supplier payments are already under pressure.”
The second statement tells management where the battlefield is.
The first statement tells them only where the bank account is.
4. The Deterministic Layer: What We Already Know
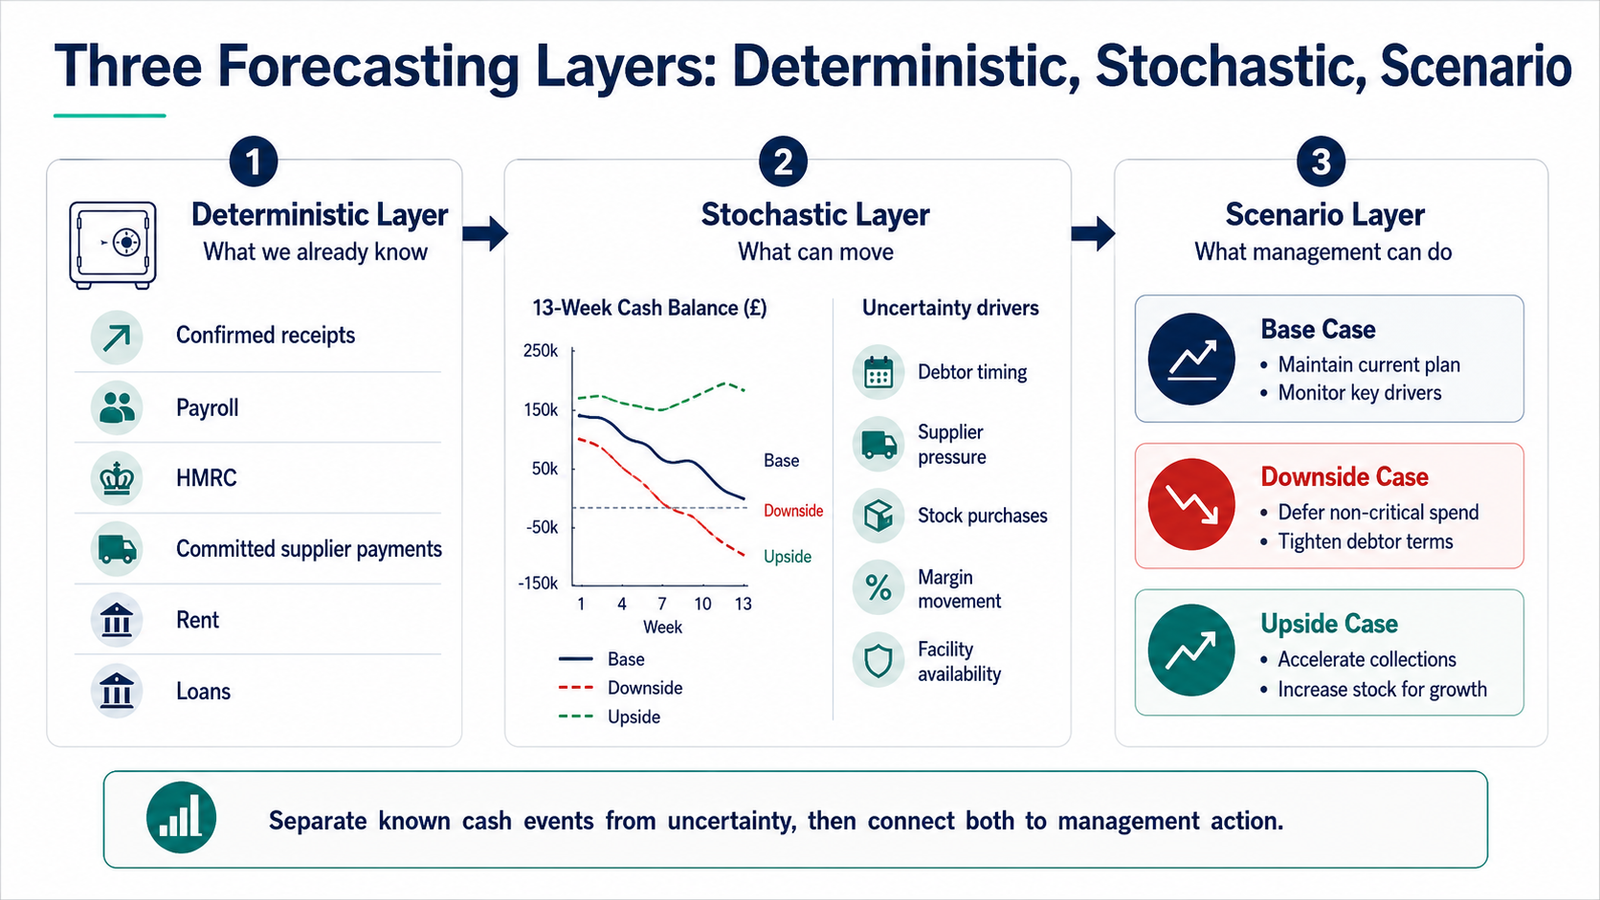
The first layer of a serious 13-week forecast is deterministic.
This is the part of the forecast built from events that are already known, committed, scheduled or highly probable.
In practical terms, this usually covers the first one to four weeks most strongly, depending on the business model, payment discipline, sector and data quality.
The deterministic layer should include:
confirmed bank balance;
confirmed debtor receipts;
payment promises already received;
committed supplier payments;
payroll;
rent;
HMRC payments;
loan repayments;
lease payments;
fixed operating costs;
approved purchase commitments;
signed project milestones;
unavoidable operating payments.
This layer answers one question:
What do we know with high confidence?
Not what do we hope.
Not what do we expect if everything goes well.
What do we know?
That distinction matters.
A customer who usually pays on time is not the same as a confirmed receipt.
A supplier payment you hope to defer is not the same as an agreed deferral.
A project milestone you expect to invoice is not the same as an approved invoice.
A sales order is not the same as cash.
| Forecast item | Classification | Treatment |
|---|---|---|
| Cash already in bank | Certain | Include as opening cash |
| Payroll due next Friday | Committed | Include as fixed outflow |
| HMRC payment due on statutory date | Committed | Include as fixed outflow |
| Customer confirmed payment date | High confidence | Include, but monitor |
| Customer historically pays late | Medium / low confidence | Include in base case with caution |
| New sales pipeline | Assumption | Do not treat as deterministic cash |
| Supplier deferral not yet agreed | Assumption | Do not remove payment until confirmed |
This is one of the most practical controls in cash forecasting:
Do not allow hope to enter the deterministic layer.
Hope belongs in scenario modelling.
5. The Stochastic Layer: What Can Move
The second layer is stochastic.
This is where the forecast admits reality.
The future is not one clean line. Cash moves because people behave differently from spreadsheets.
Customers pay late.
Suppliers push harder.
Projects slip.
Stock arrives early.
Payroll does not wait.
HMRC does not care about optimism.
Margins move.
Facilities tighten.
Receipts land one week later than planned, and suddenly the “safe” week becomes a pressure week.
The stochastic layer asks:
What can move, by how much, and what happens if it moves against us?
Main uncertainty drivers:
| Driver | What can move | Cash impact |
|---|---|---|
| Debtor timing | Receipts slip by 1–4 weeks | Liquidity gap |
| Sales conversion | Expected orders convert later | Inflows reduce |
| Project delivery | Milestones delayed | Invoices delayed |
| Supplier timing | Creditors demand earlier payment | Outflows accelerate |
| Stock purchases | Stock bought before receipts arrive | Working capital pressure |
| Margin movement | Costs rise or pricing weakens | Cash generation falls |
| Payroll / HMRC collision | Fixed obligations fall together | Pressure week |
| Facility availability | Headroom reduced or restricted | Lower protection |
| Customer concentration | One debtor controls liquidity | High dependency risk |
A weak forecast gives one line.
A strong forecast gives a range.
Research on real-world daily cash-flow data from small and medium companies found that common assumptions such as normality, absence of correlation and stationarity hardly appeared in practice, and that non-linearity was often relevant for forecasting. In plain business language: cash flow does not move like a calm straight line. It bends, delays, accelerates and collides with operational reality. [1]
This is why management needs more than one forecast line.
It needs:
base case;
downside case;
upside case;
risk envelope;
lowest weekly cash;
minimum buffer breach;
facility headroom;
timing sensitivity.
The question is no longer:
“What is the forecast?”
The question becomes:
“How fragile is the forecast?”
That is the question that matters.
6. Scenario Layer: What Management Can Do
Scenario modelling is often misunderstood.
It is not there to make the spreadsheet look advanced.
It is there to prepare decisions before pressure arrives.
A useful 13-week cash forecast should show at least three scenarios.
Base Case
Normal trading assumptions.
Receipts arrive broadly as expected. Supplier payments follow planned timing. Payroll, HMRC and fixed commitments are paid as scheduled. No major shock is assumed.
The base case answers:
What happens if the business performs as expected?
Downside Case
This is where the forecast becomes honest.
Debtors pay later. Sales convert more slowly. Supplier pressure increases. HMRC or payroll collides with lower receipts. A project receipt slips. Stock or operating costs consume cash earlier than expected.
The downside case answers:
What happens if timing moves against us?
Upside Case
Receipts arrive earlier. Collections improve. Non-critical spend is delayed. Sales conversion improves. Supplier timing is negotiated. Facility headroom remains available.
The upside case answers:
What happens if management acts well and assumptions improve?
But the real value is not the three cases.
The value is the action list.
| Problem shown by scenario | Management action |
|---|---|
| Debtor receipts delayed | Escalate collections, call key debtors, agree payment dates |
| Cash falls below buffer | Delay non-critical spend, protect facility headroom |
| Supplier payments collide with payroll | Negotiate payment timing, prioritise critical suppliers |
| HMRC payment creates pressure week | Prepare cash early, avoid surprise collision |
| Stock purchase consumes cash | Reduce order size, delay purchase, renegotiate terms |
| Project receipts slip | Rephase forecast, check delivery blockers |
| Facility headroom becomes tight | Speak to the bank early, prepare evidence |
| Margin pressure appears | Review pricing, discounting, purchase cost and sales mix |
This is why the 13-week forecast must not end with “base, upside, downside”.
It must end with:
What are we doing this week?
7. The Pressure Week
Every 13-week forecast should identify the pressure week.
The pressure week is not always the week with the lowest closing cash. Sometimes it is the week where the business still survives on paper, but only if several fragile assumptions hold.
The pressure week is where cash timing, operational commitments and risk collide.
Typical pressure-week causes:
payroll and HMRC in the same week;
supplier run before debtor receipts;
HMRC payment before customer receipts;
stock purchase before sales cash;
loan repayment during a low-receipt week;
rent, payroll and supplier payments clustering together;
facility headroom reducing just as working capital stretches.
A management forecast should show the pressure week like this:
| Pressure-week signal | Example |
|---|---|
| Week | Week 7 |
| Forecast closing cash | £42,000 |
| Minimum buffer | £100,000 |
| Buffer position | £58,000 below buffer |
| Main cause | Payroll + HMRC + suppliers before debtor receipts |
| Downside risk | One debtor delay creates liquidity gap |
| Management decision | Chase receipts, defer spend, confirm facility |
This is where the forecast becomes a live conversation.
Not:
“Week 7 is green.”
But:
“Week 7 only remains safe if two debtor receipts arrive before payroll and HMRC. If not, we breach the buffer. What action do we take now?”
That is forecasting.
8. Forecast Variance: What Changed Since Last Week?
A 13-week forecast is not a one-off report.
It is a rolling discipline.
Every week, the business should compare actual cash movement against the previous forecast.
Not to blame finance.
To learn.
| Question | Why it matters |
|---|---|
| Which receipts arrived as forecast? | Tests debtor reliability |
| Which receipts slipped? | Updates cash timing risk |
| Which payments were higher than expected? | Reveals cost or control pressure |
| Which payments were brought forward? | Shows supplier pressure |
| Which costs were missing? | Reveals weak source data |
| Which assumptions changed? | Updates scenario logic |
| Did the pressure week move? | Shows whether risk increased or reduced |
| Did buffer headroom improve or worsen? | Shows liquidity resilience |
| Did management actions work? | Tests decision quality |
Forecast variance is not failure.
Forecast variance is intelligence.
If the forecast changes every week, that is not a problem. The business is alive. The model must respond.
The real problem is when the forecast changes and nobody asks why.
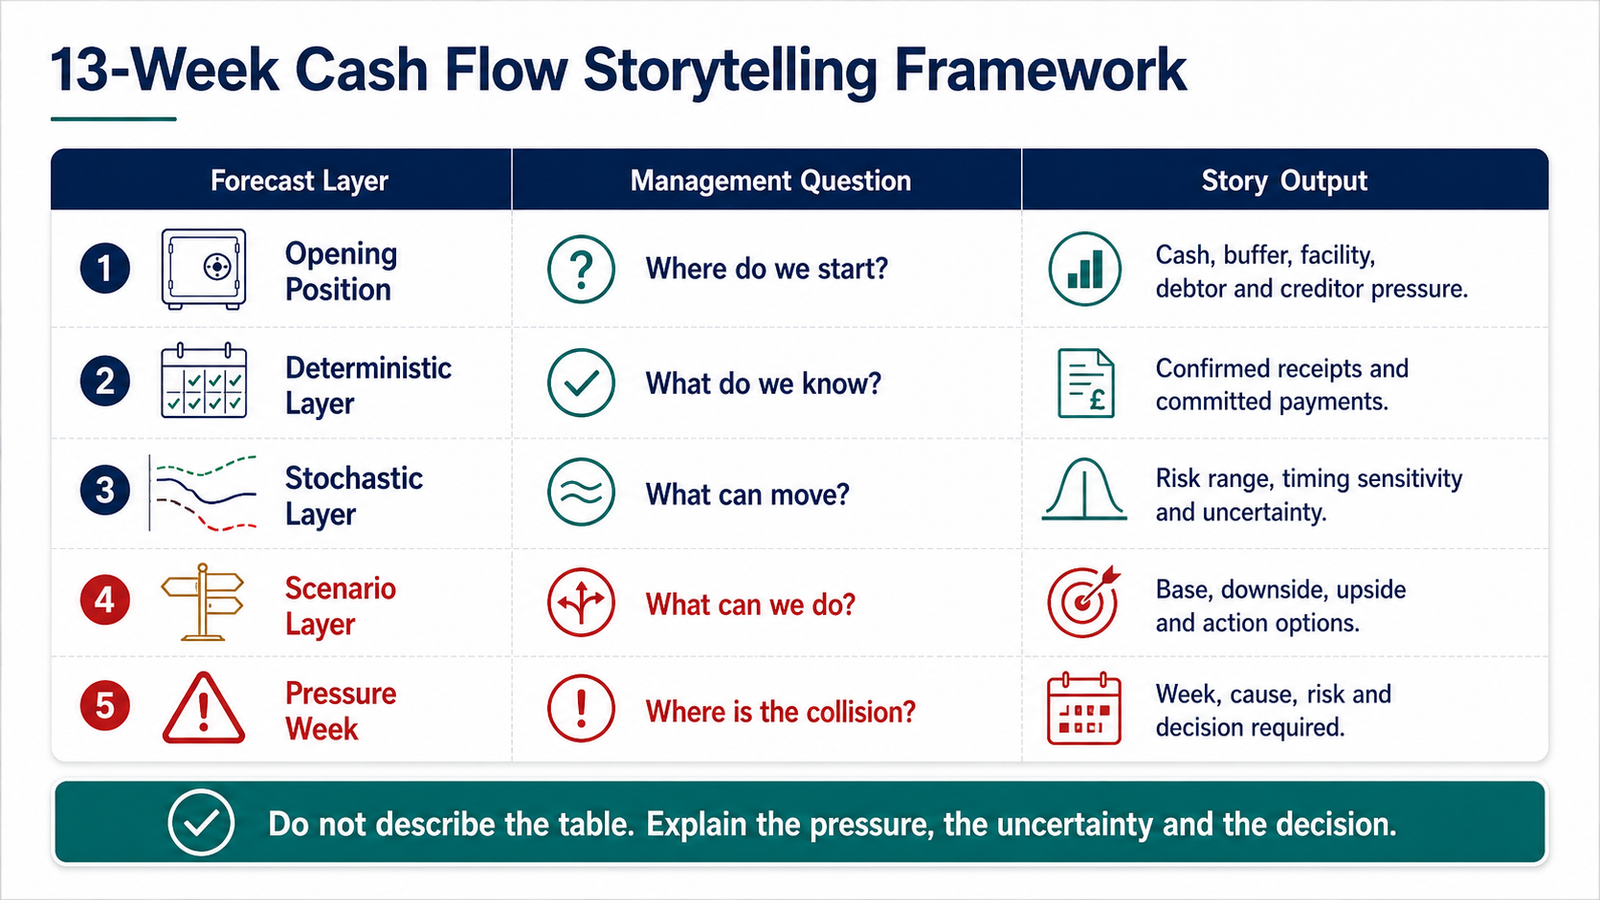
9. Storytelling: Do Not Describe the Table — Explain the Pressure
The biggest mistake in presenting a 13-week cash flow forecast is to walk management through the table row by row.
That is not storytelling.
That is narration of a spreadsheet.
A management team does not need the finance person to read out numbers that are already on the screen. They need the finance person to explain what the numbers mean, where the danger is, what has changed, and what must be done.
A weak presentation says:
“Cash decreases in week 7 because payments are higher than receipts.”
That is a description.
A stronger presentation says:
“Week 7 is the pressure point. Payroll, HMRC and supplier payments land before two major debtor receipts. If either debtor slips by one week, we breach the minimum buffer. The decision today is whether we chase collection aggressively, defer non-critical spend, or confirm facility headroom.”
That is a management story.
The difference is context.
A table shows values.
A story explains tension.
A decision-focused forecast shows the action required.
Research on data storytelling supports this principle. A 2024 study found that data stories improved the efficiency of comprehension tasks and improved effectiveness for single-insight comprehension compared with conventional visualisations. The same idea applies in a cash-flow meeting: do not describe the table; explain the pressure, the uncertainty and the decision. [2]
A 13-week cash flow story should answer five questions:
| Story question | What management needs |
|---|---|
| Where do we start? | Opening cash, facility headroom, minimum buffer |
| Where does pressure appear? | The pressure week and lowest cash point |
| Why does it appear? | Debtors, suppliers, payroll, HMRC, stock, margin or project timing |
| How fragile is the forecast? | Base, upside, downside and buffer sensitivity |
| What must we do now? | Collection, deferral, funding, cost control or operational action |
This is why context is more important than table description.
The table may show that week 7 closes at £42,000.
But context explains that the £42,000 depends on two debtors paying before payroll, HMRC and supplier pressure collide.
The table shows the number.
The story shows the risk.
The decision shows the value.
10. The Five-Sentence Cash Forecast Presentation
A strong cash forecast presentation should be short enough to be understood and sharp enough to create action.
A practical structure is the five-sentence format.
1. Starting position
“We start the week with £500,000 cash, £250,000 minimum buffer and £150,000 available facility headroom.”
2. Runway
“Across the 13-week runway, the lowest forecast point is week 7.”
3. Pressure reason
“The pressure is caused by payroll, HMRC and supplier payments falling before two major debtor receipts.”
4. Scenario risk
“In the base case we remain above zero, but in the downside case one debtor delay pushes us below the minimum buffer.”
5. Decision required
“The decision this week is to escalate collections, defer non-critical spend and confirm facility headroom.”
This is how finance becomes useful.
Not by showing every row.
By showing what the rows mean.
A finance table without this narrative creates passive awareness.
A forecast story creates management movement.
11. Why Debtor Timing Cannot Be Treated as Certain
Late payment is not a small administrative nuisance.
It is a liquidity threat.
UK reporting on government late-payment reforms has stated that late payments cost the economy around £11 billion a year and contribute to the closure of 38 businesses daily. [3]
That is why debtor receipts should not be treated as guaranteed cash simply because they appear in the forecast.
For many SMEs, one delayed invoice is not a minor variance.
It can be the difference between a manageable pressure week and a liquidity crisis.
A forecast that treats every debtor receipt as certain is not conservative.
It is naive.
In a serious 13-week forecast, debtor receipts should be classified:
| Debtor receipt type | Treatment |
|---|---|
| Cash already received | Certain |
| Confirmed payment date | High confidence, monitored |
| Reliable customer, normal terms | Base case |
| Historically late payer | Base/downside sensitivity |
| Disputed invoice | Downside or excluded until resolved |
| Large debtor controlling liquidity | Separate risk flag |
| Unconfirmed promise | Assumption, not fact |
This is practical finance.
Not pessimism.
Not drama.
Just discipline.
12. Why the Direct Cash View Matters
A 13-week forecast should be built close to actual cash movement.
This is why the direct cash view matters.
Formal cash-flow reporting under IAS 7 provides the accounting context for cash-flow statements, including classification of operating, investing and financing cash flows. But a 13-week management forecast has a more immediate operational purpose: to show what cash is expected to arrive, what cash must leave, and where timing creates pressure. [4]
For short-term liquidity management, the direct view is usually more useful than starting from profit and adjusting backwards.
The direct view asks:
| Accrual view may show | Direct cash view asks |
|---|---|
| Revenue | When will the customer actually pay? |
| Profit | Can the business fund the next 13 weeks? |
| Debtors | Which receipts are confirmed, assumed or at risk? |
| Creditors | Which payments are fixed, flexible or under pressure? |
| Payroll cost | When does cash leave the bank? |
| Tax liability | Which week does HMRC cash pressure hit? |
| Stock / project cost | Is cash leaving before receipts arrive? |
This is the difference between accounting recognition and liquidity control.
Accrual accounting may explain performance.
Cash timing explains survival.
A profitable business can still run out of cash if receipts arrive too late, payments cluster too early, or facility headroom disappears before management acts.
That is why the 13-week forecast should speak in cash events, not only accounting categories.
13. The Weekly Cash War-Room Rhythm
If a business is under pressure, the 13-week forecast should not be reviewed once a month.
It should be reviewed weekly.
In more serious conditions, parts of it may need daily tracking.
A practical weekly rhythm:
| Day / stage | Action |
|---|---|
| Monday morning | Update opening cash and actual receipts/payments |
| Monday midday | Compare actuals to last forecast |
| Monday afternoon | Refresh week 1–13 forecast |
| Tuesday | Review debtor promises, supplier pressure, HMRC/payroll timing |
| Wednesday | Decide actions: collections, payment timing, spend control |
| Thursday | Confirm progress on critical actions |
| Friday | Update management on cash risks and changes |
For many SMEs, the discipline does not need to be complicated.
It needs to be consistent.
The same questions every week:
What changed?
What moved?
What became more certain?
What became more risky?
Which week is now the pressure week?
What decision do we need to make before Friday?
This is where cash forecasting becomes management behaviour, not finance administration.
14. How CF Compass Thinks About This
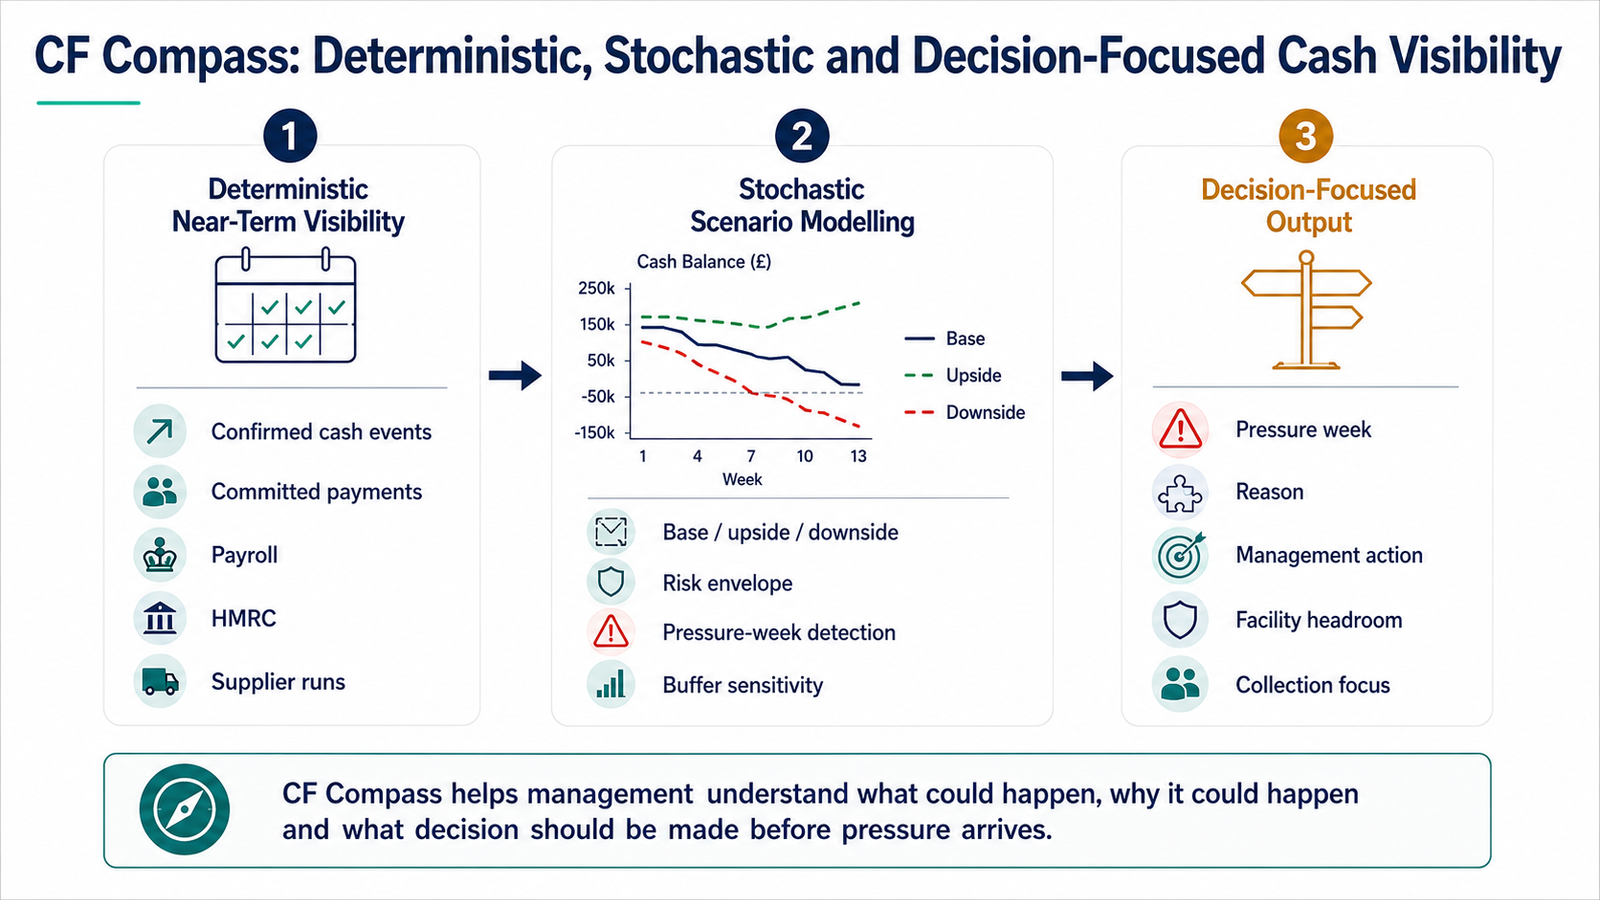
This thinking is central to CF Compass.
The purpose is not to create another static 13-week cash table. The purpose is to help management see the cash story.
A useful cash-flow system should not say only:
“Here is the forecast.”
It should say:
“Here is the opening position, here is the pressure week, here is why the pressure appears, here is what could move, and here is the decision required now.”
CF Compass is designed around three connected layers.
Deterministic near-term visibility
Known and highly probable cash movements are separated from assumptions.
This means confirmed bank balances, committed payments, payroll, HMRC obligations, supplier runs and confirmed debtor receipts are not mixed carelessly with hopes, pipeline, or optimistic timing.
Stochastic scenario modelling
The future does not move in one clean line. Receipts, payments and operational assumptions can shift.
CF Compass thinking recognises the need for base, upside and downside views, forecast range, risk envelope and pressure-week detection.
Decision-focused output
The forecast should not only show numbers.
It should identify the pressure week, explain why it appears and show what management can do before pressure becomes crisis.
That is the difference between a forecast table and a management cockpit.
In simple terms:
CF Compass helps management understand what could happen, why it could happen and what decision should be made before pressure arrives.
It should not pretend to know the future.
It should improve the quality of management preparation.
15. What a Great 13-Week Cash Forecast Should Show
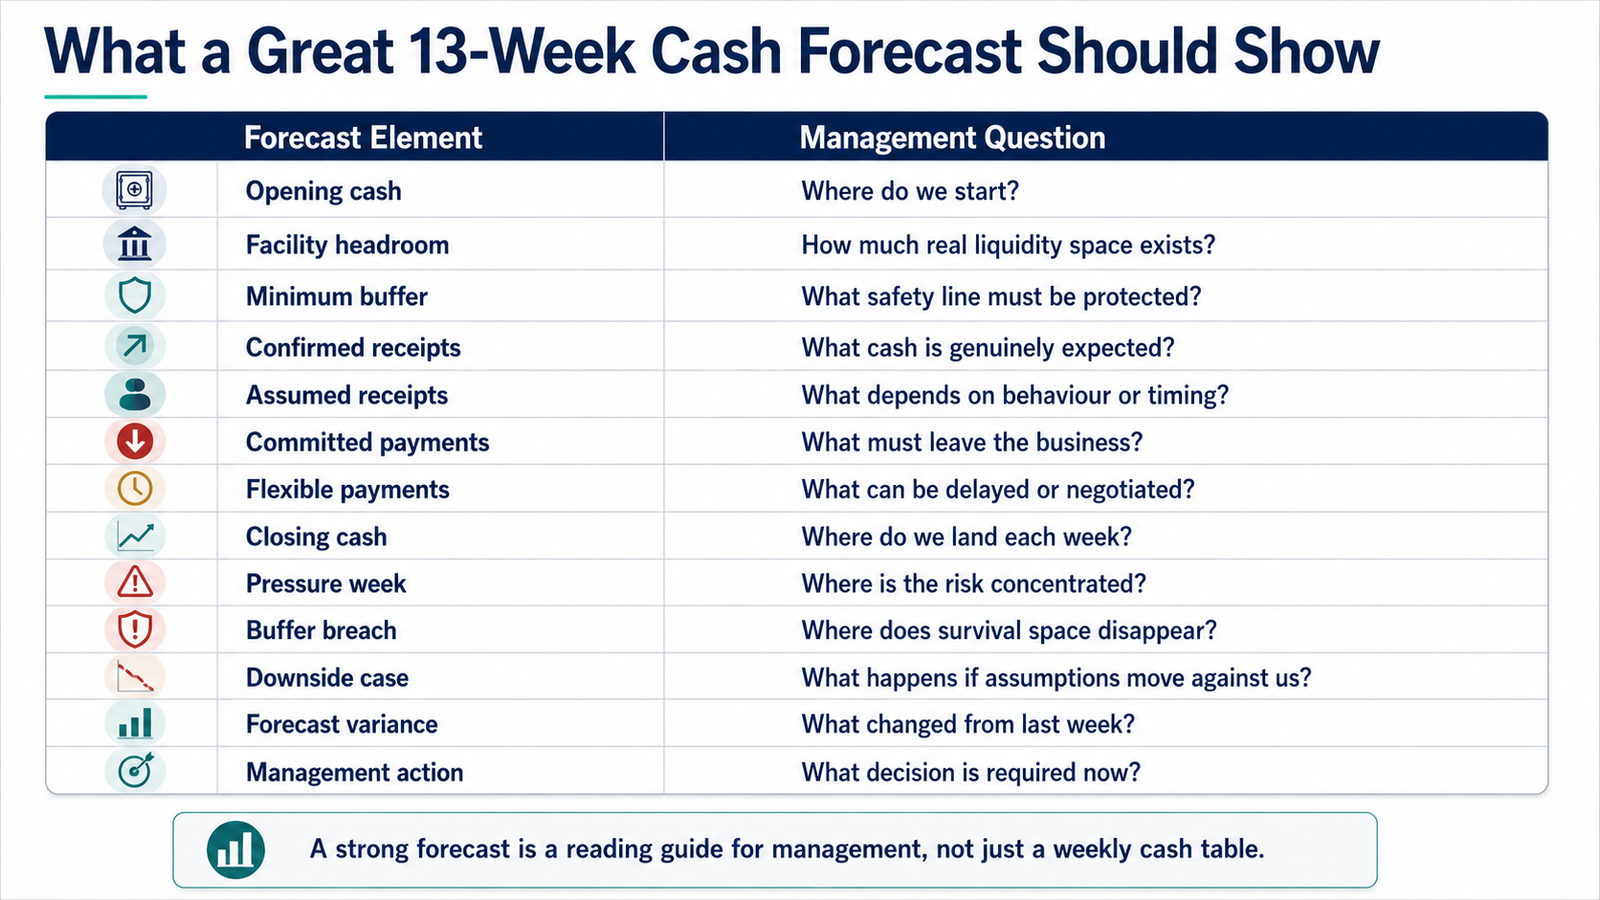
A great 13-week cash forecast should show more than weekly cash balances.
It should show the management story.
| Forecast element | Management question |
|---|---|
| Opening cash | Where do we start? |
| Facility headroom | How much real liquidity space exists? |
| Minimum buffer | What safety line must be protected? |
| Confirmed receipts | What cash is genuinely expected? |
| Assumed receipts | What depends on behaviour or timing? |
| Committed payments | What must leave the business? |
| Flexible payments | What can be delayed or negotiated? |
| Closing cash | Where do we land each week? |
| Pressure week | Where is the risk concentrated? |
| Buffer breach | Where does survival space disappear? |
| Downside case | What happens if assumptions move against us? |
| Forecast variance | What changed from last week? |
| Management action | What decision is required now? |
This table is not decoration.
It is the reading guide.
It tells management how to interpret the forecast.
16. The Real Purpose of the Forecast
The purpose of a 13-week cash forecast is not to predict the future perfectly.
That is impossible.
The purpose is to improve readiness.
It gives management time to act before pressure becomes crisis.
It connects finance to debtors, creditors, payroll, HMRC, stock, margin, project timing, operational delivery, facilities and decision-making.
The best forecast is not the one with the most rows.
It is the one that changes what management does this week.
That is why 13-week cash flow forecasting is a management story, not a finance table.
It is not enough to show the number.
You must show the collision.
You must show the risk.
You must show the decision.
And you must do it before the glass breaks.
Your job is not to report the weather.
Your job is to weather the storm.
Want to see this logic inside CF Compass?
CF Compass is being built to turn 13-week cash flow forecasting into a management control system: deterministic near-term cash visibility, scenario range, pressure-week detection and decision-focused output.
Explore Horizon Suite or contact IBeOne to discuss how this approach can support cash visibility, liquidity discipline and better management decisions in your business.
Sources and Professional References
- Salas-Molina et al. — Empirical analysis of daily cash flow time series and its implications for forecasting — Used to support the point that real cash-flow behaviour in small and medium companies often does not follow clean statistical assumptions, and that non-linearity can be relevant for forecasting. View source
- Shao et al. — Data Storytelling in Data Visualisation — Used to support the argument that narrative presentation can improve comprehension of dense data compared with conventional visualisations. View source
- UK late-payment reform reporting — Used to support the practical risk of debtor timing, including the reported £11 billion annual economic cost of late payment and the link to 38 business closures per day. View source
- Deloitte IAS Plus — IAS 7 Statement of Cash Flows — Used only for formal accounting context around cash-flow statements and cash-flow classification. View source